Customer Service Analytics
Analytics dashboard for customer service
Your key to ongoing, organization-wide upgrades in service performance.
Make managers catalysts of performance
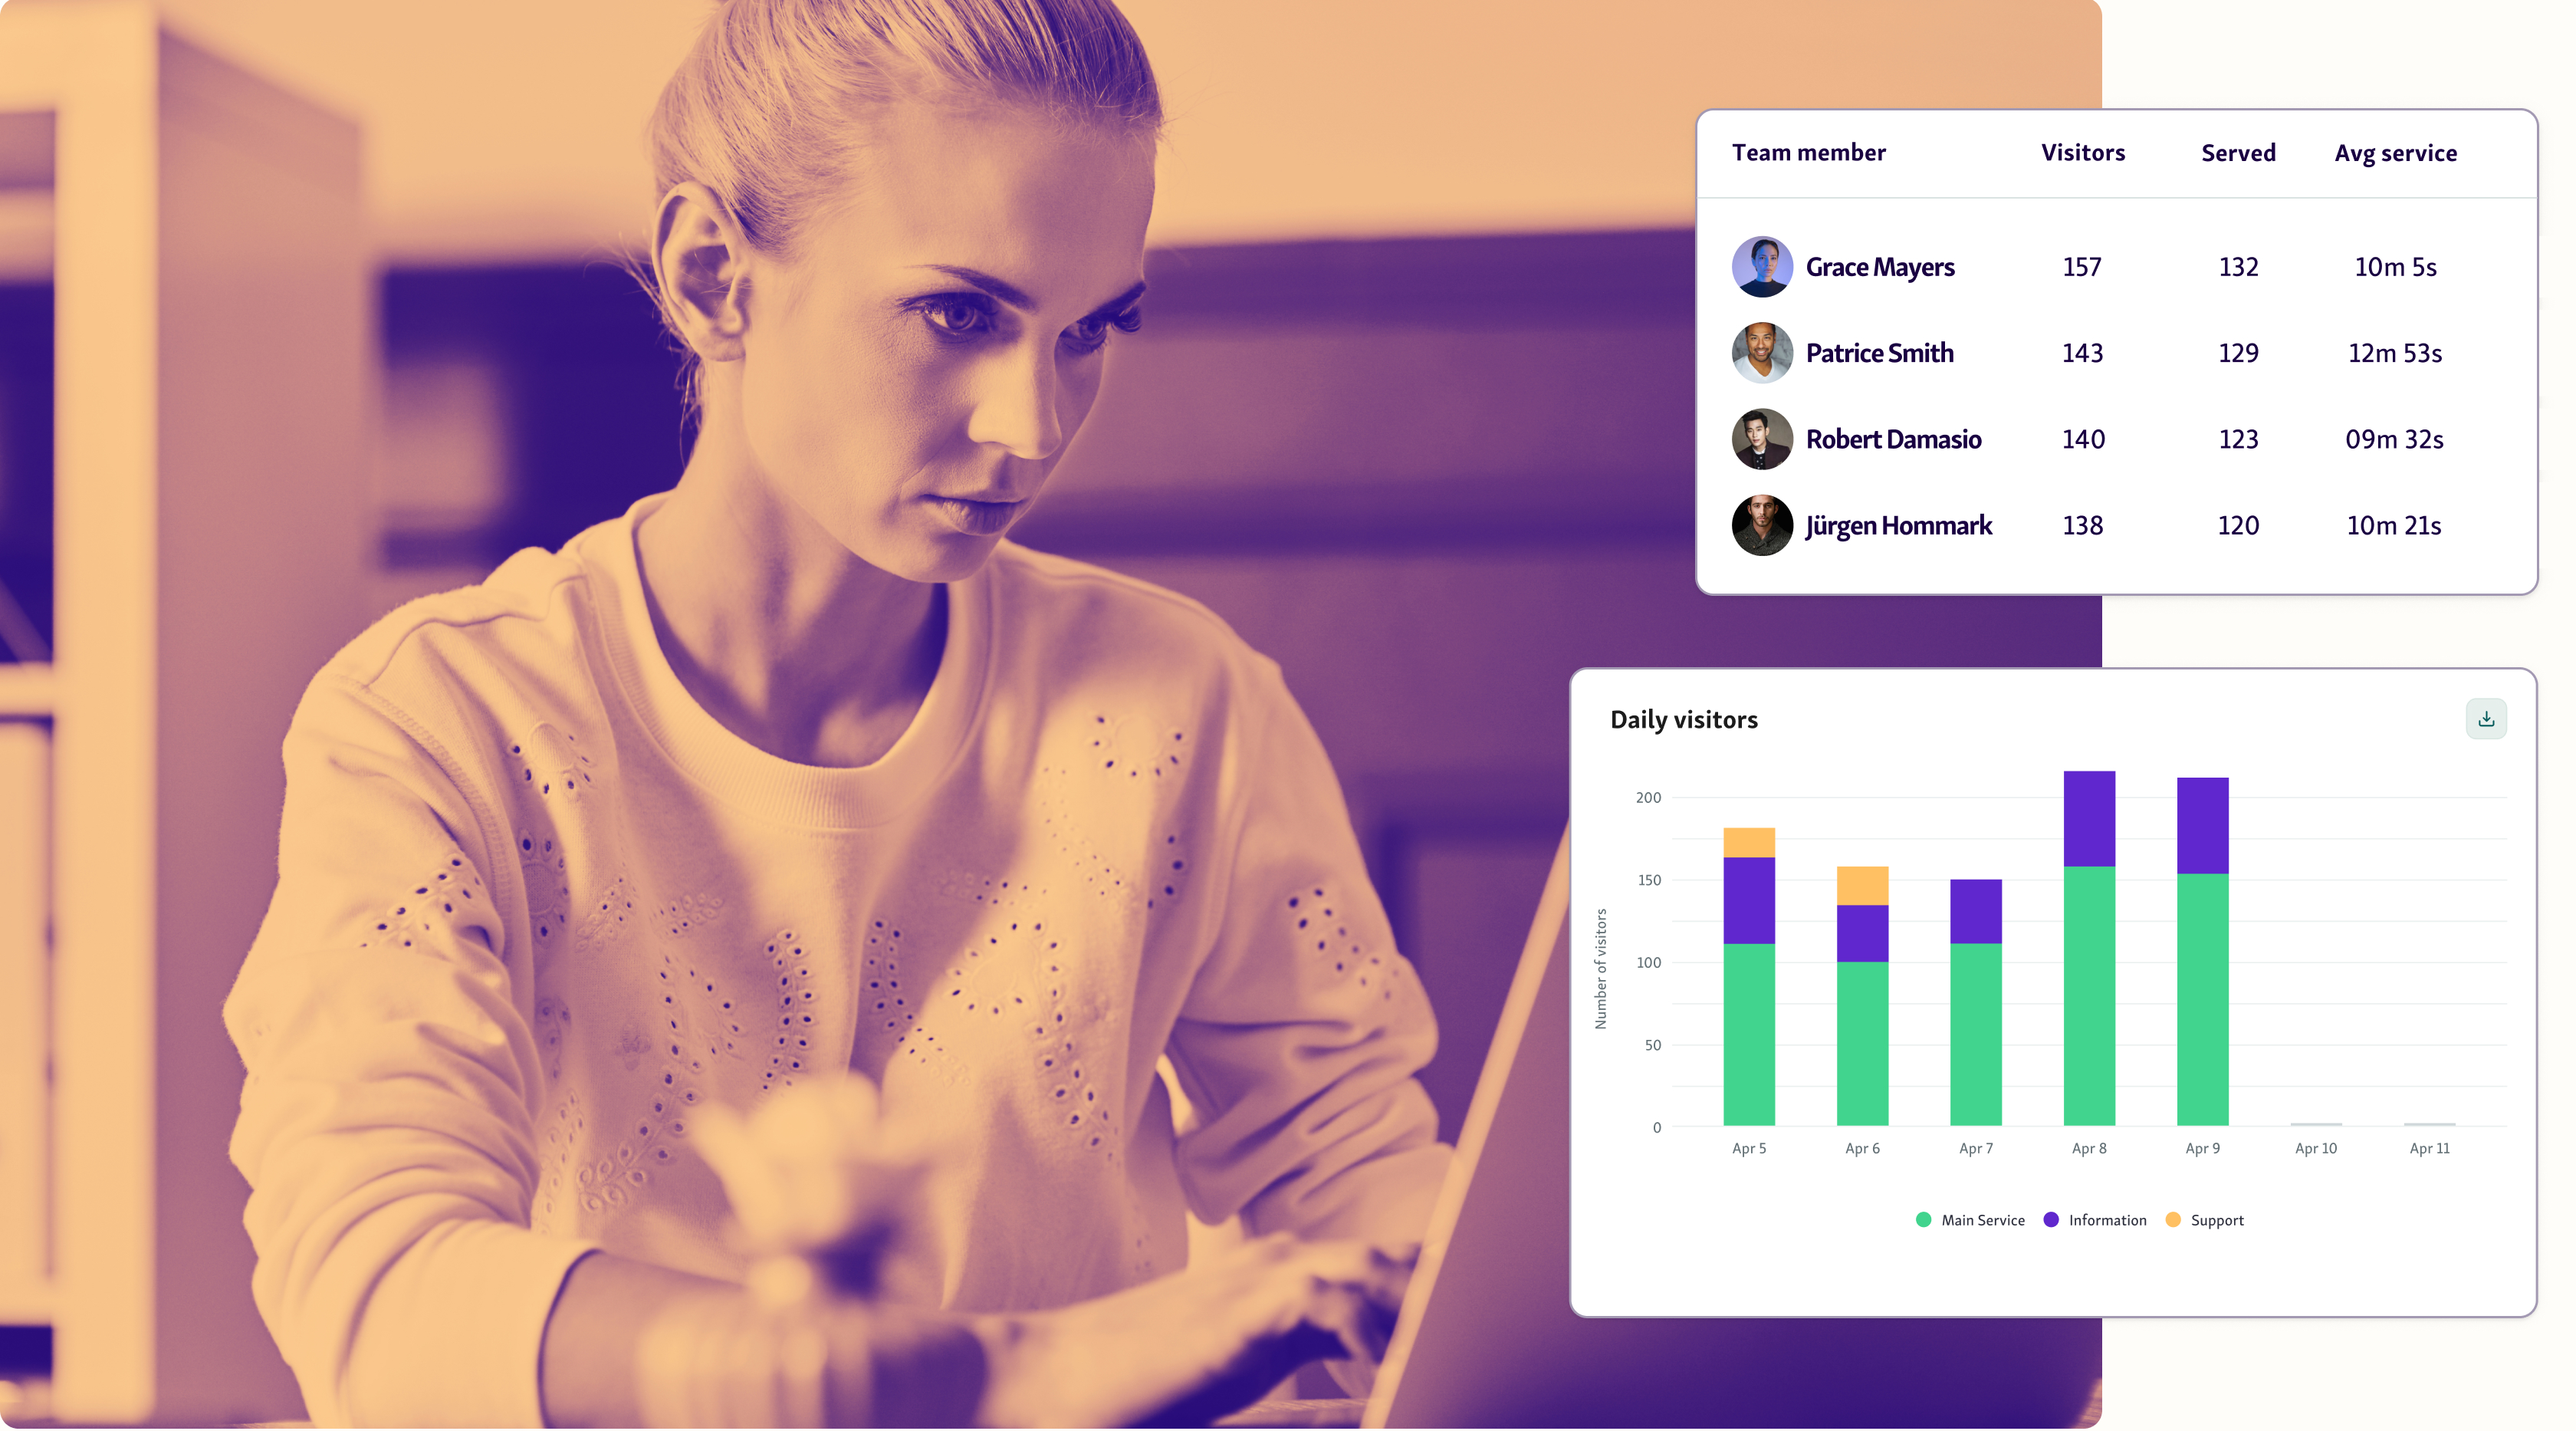
With customer service data analytics, managers can have more insightful conversations with teams, spot bottlenecks, and refine service strategy.
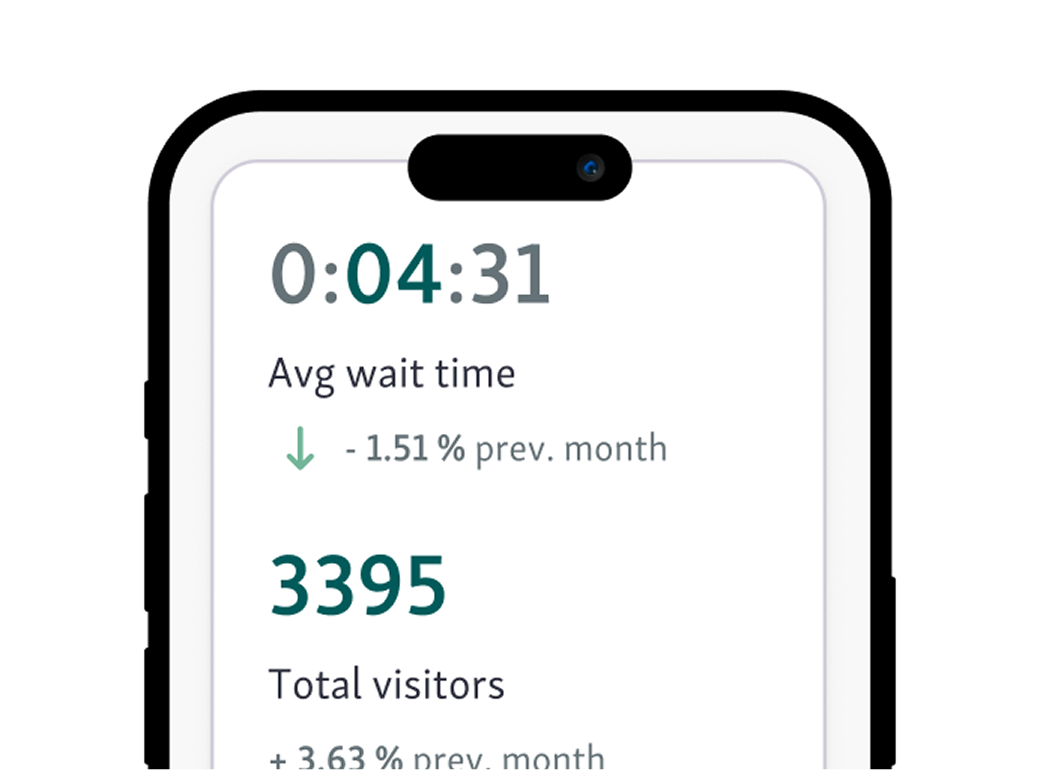
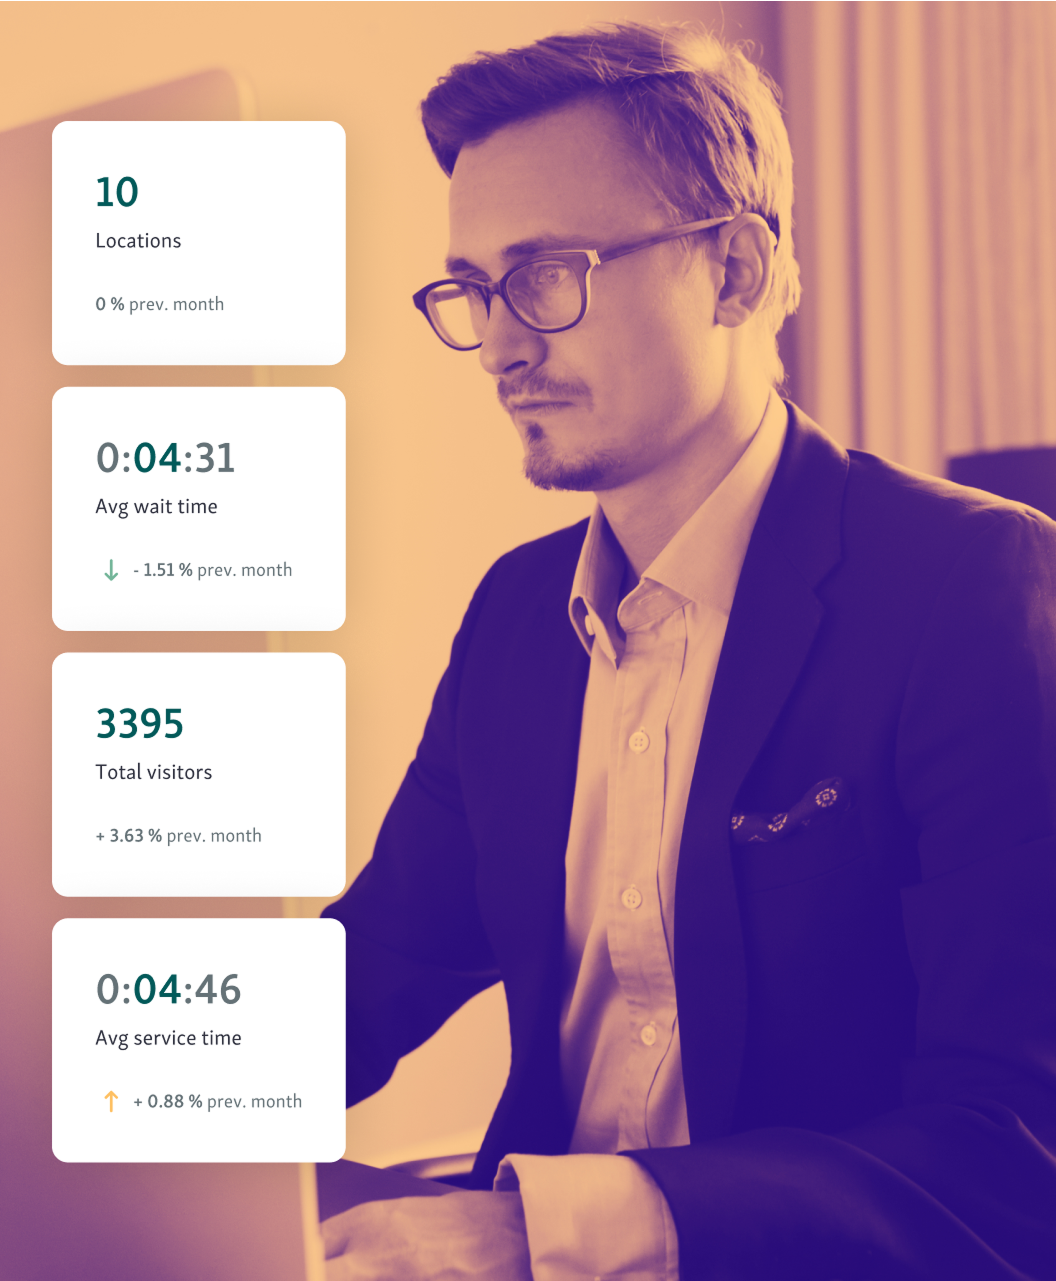
Keep your finger on the real-time pulse
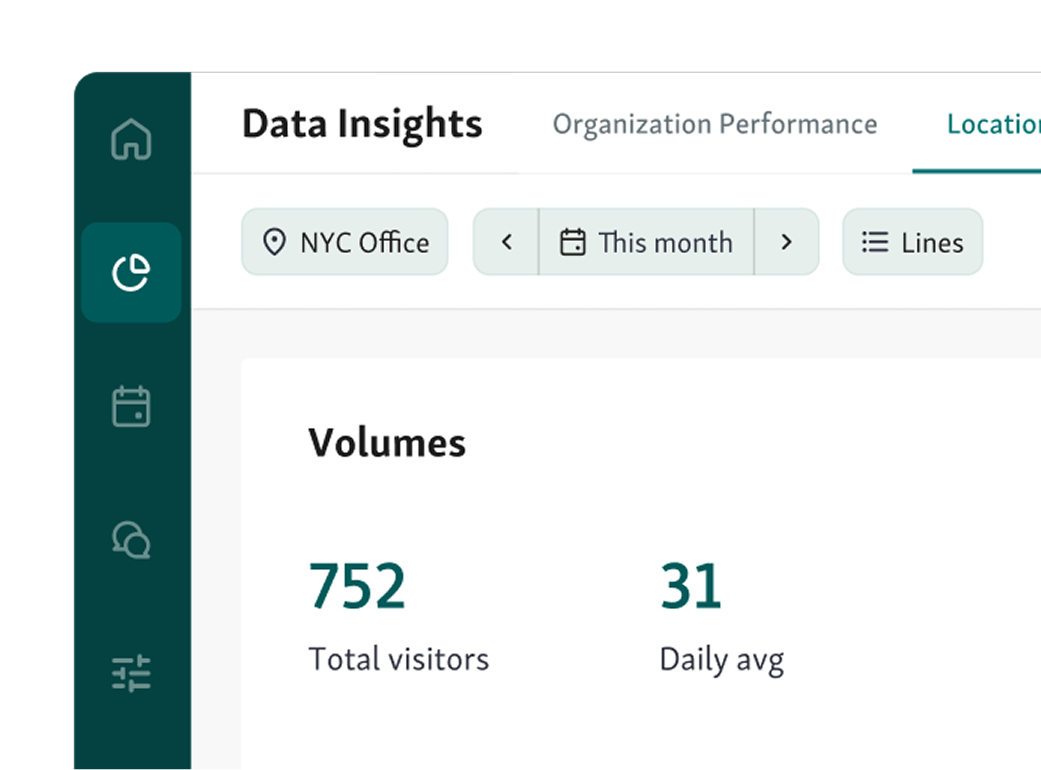
Review how your location performs
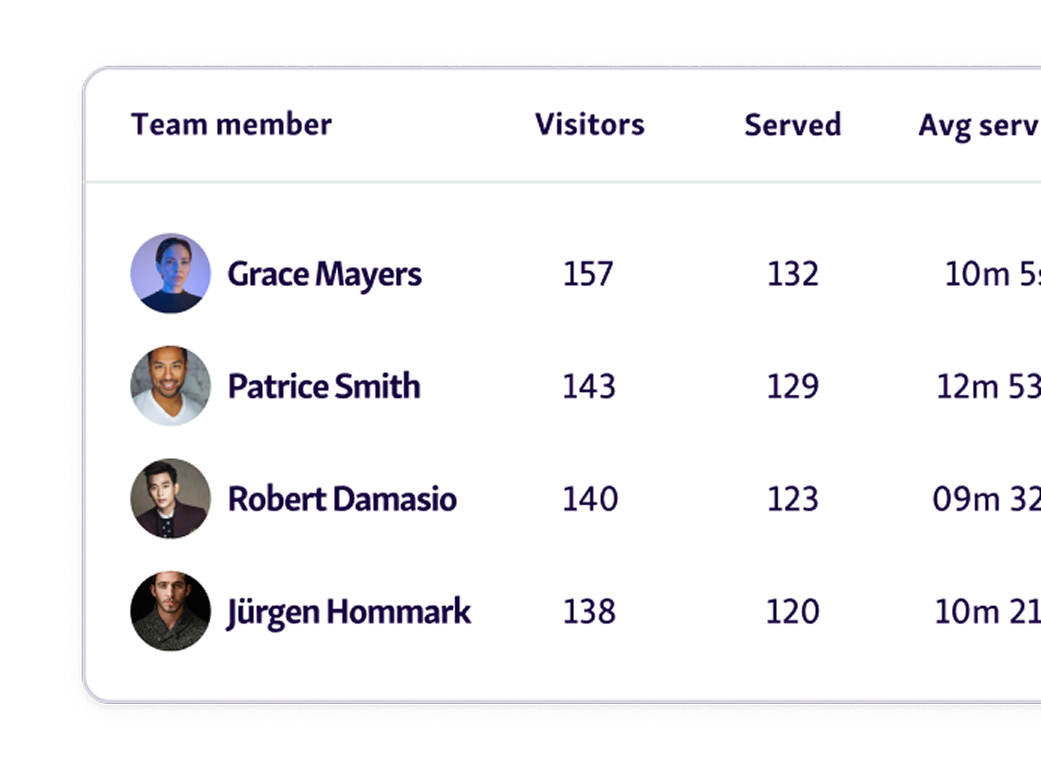
Sharpen your teams with better insight
Inform strategic decisions at the regional level
Regional managers can compare all locations in one master view, so they can spot patterns and find ways to make every location a top-performing branch.
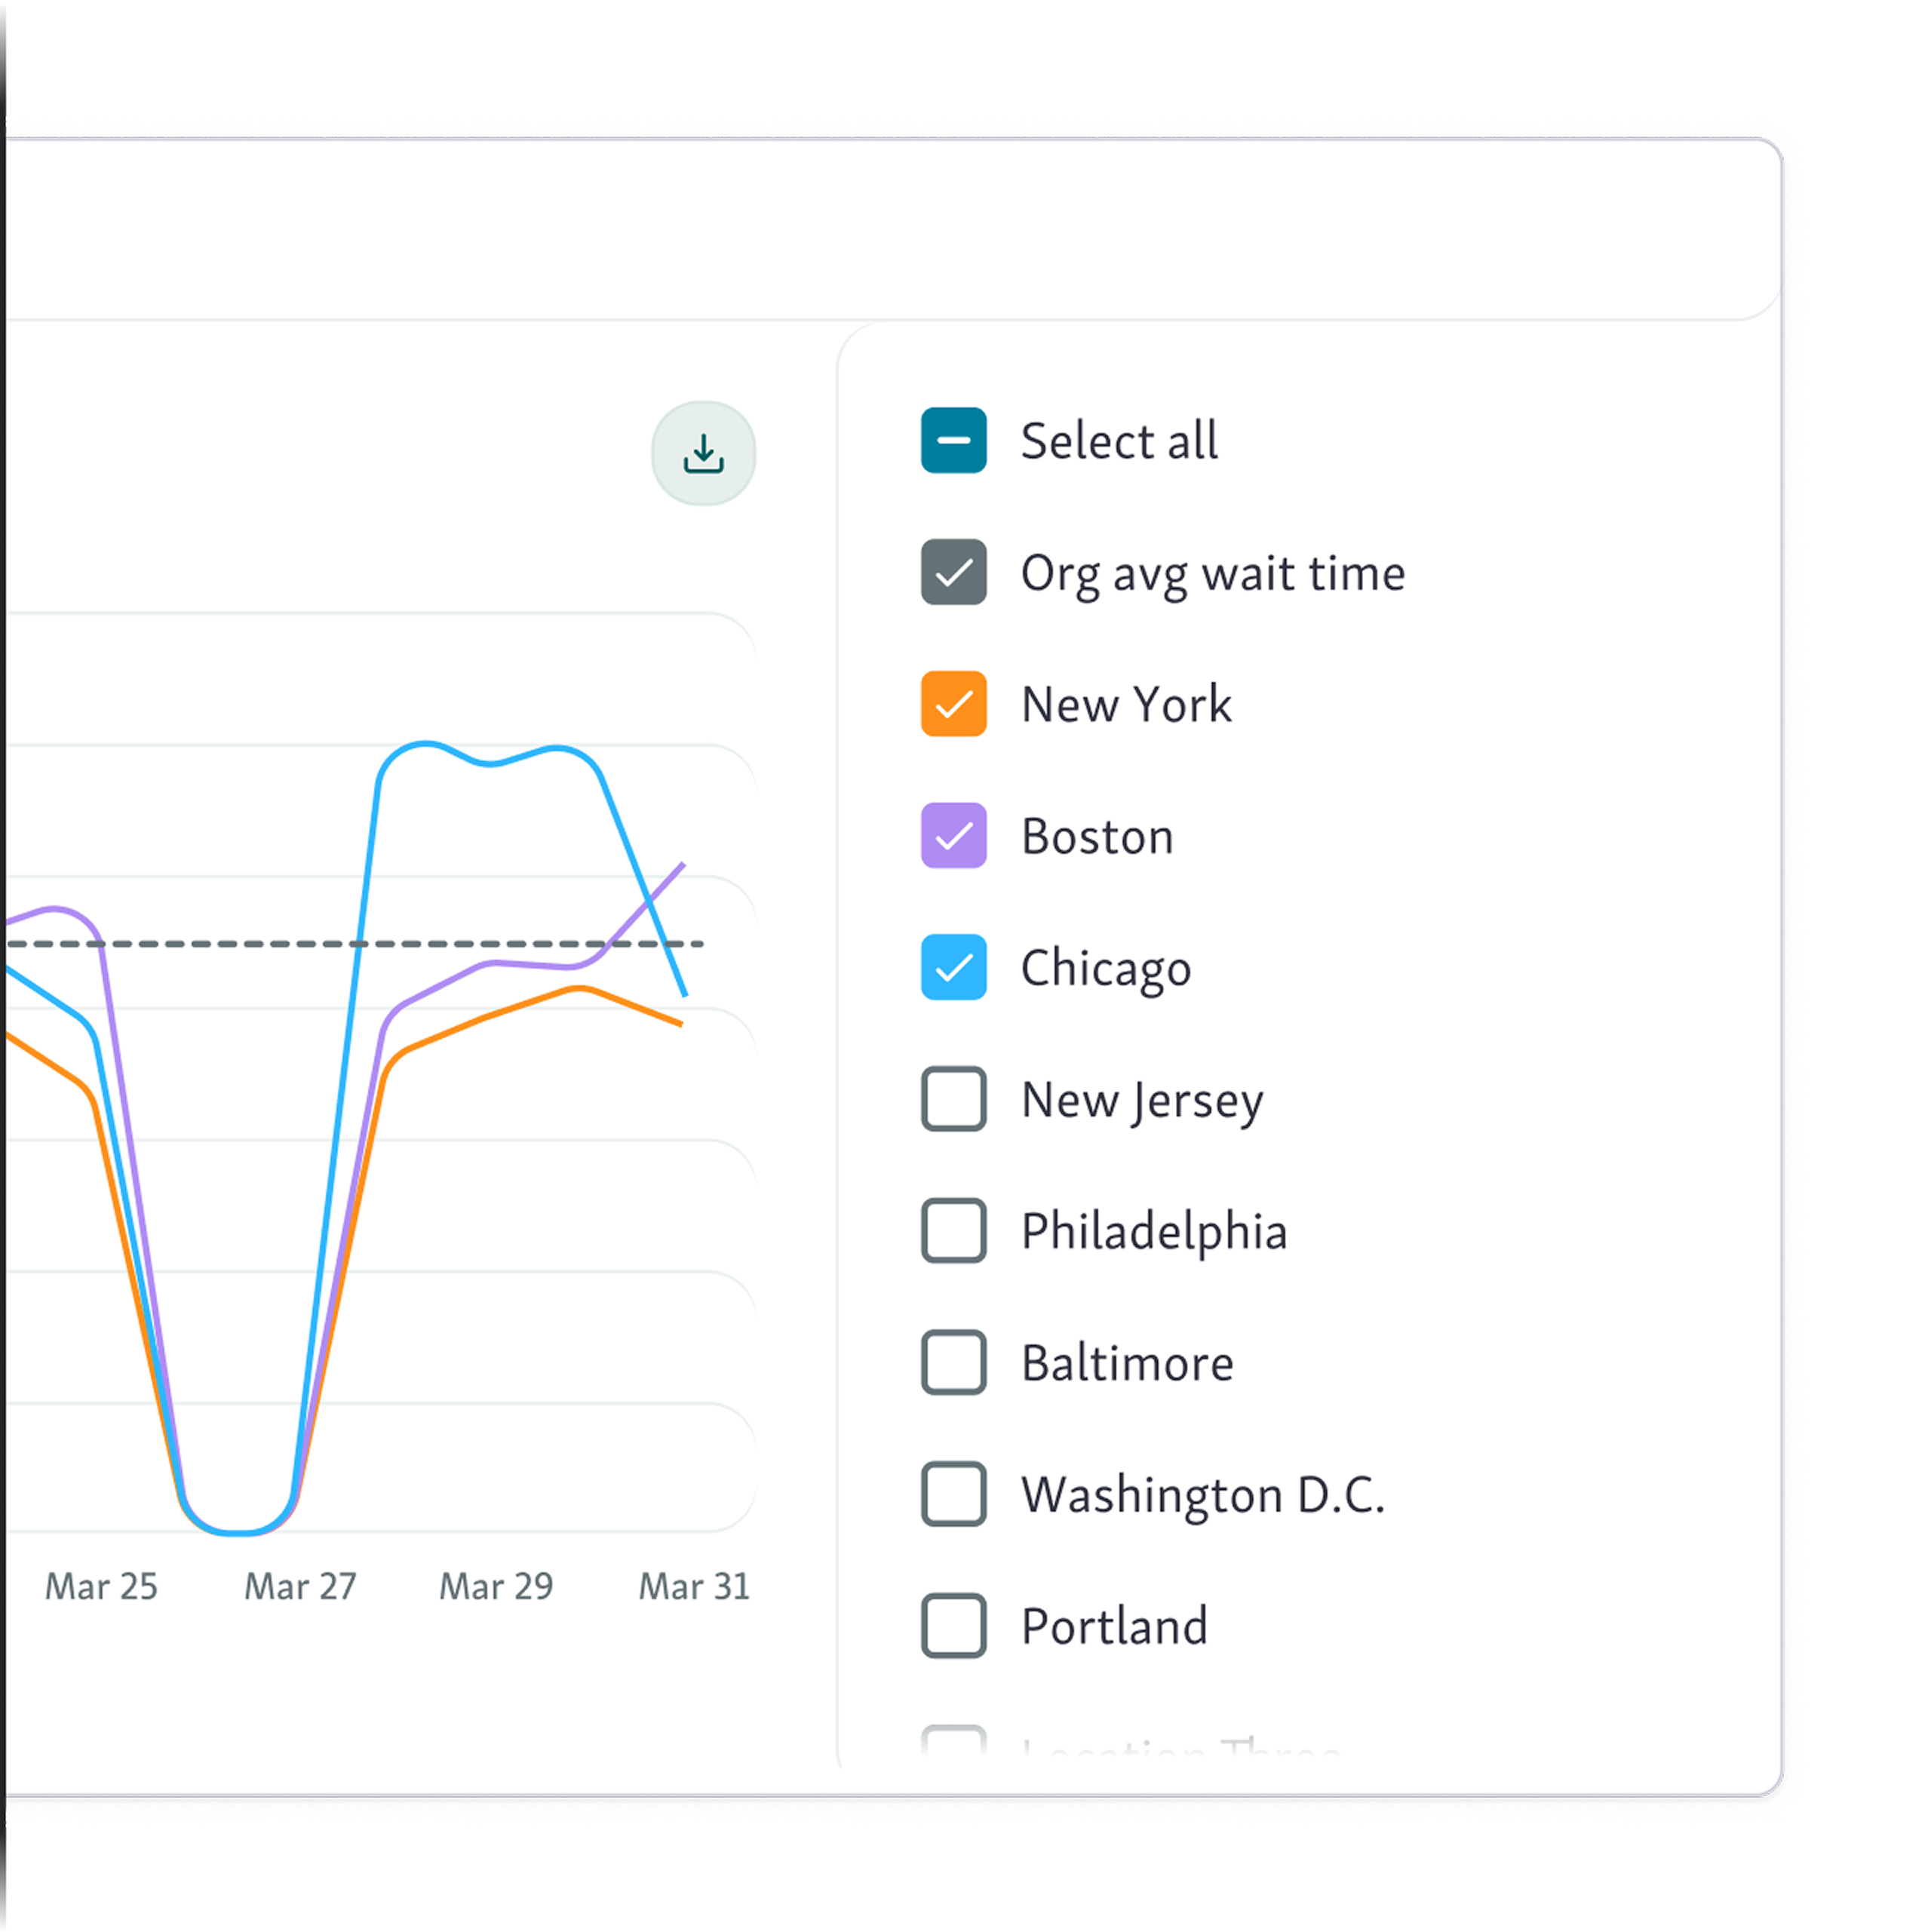
Get a feel for the UI and UX of the analytics dashboard – and see how the insights will make a difference for your organization’s strategy.
Drill down into deeper visitor, location and team insights
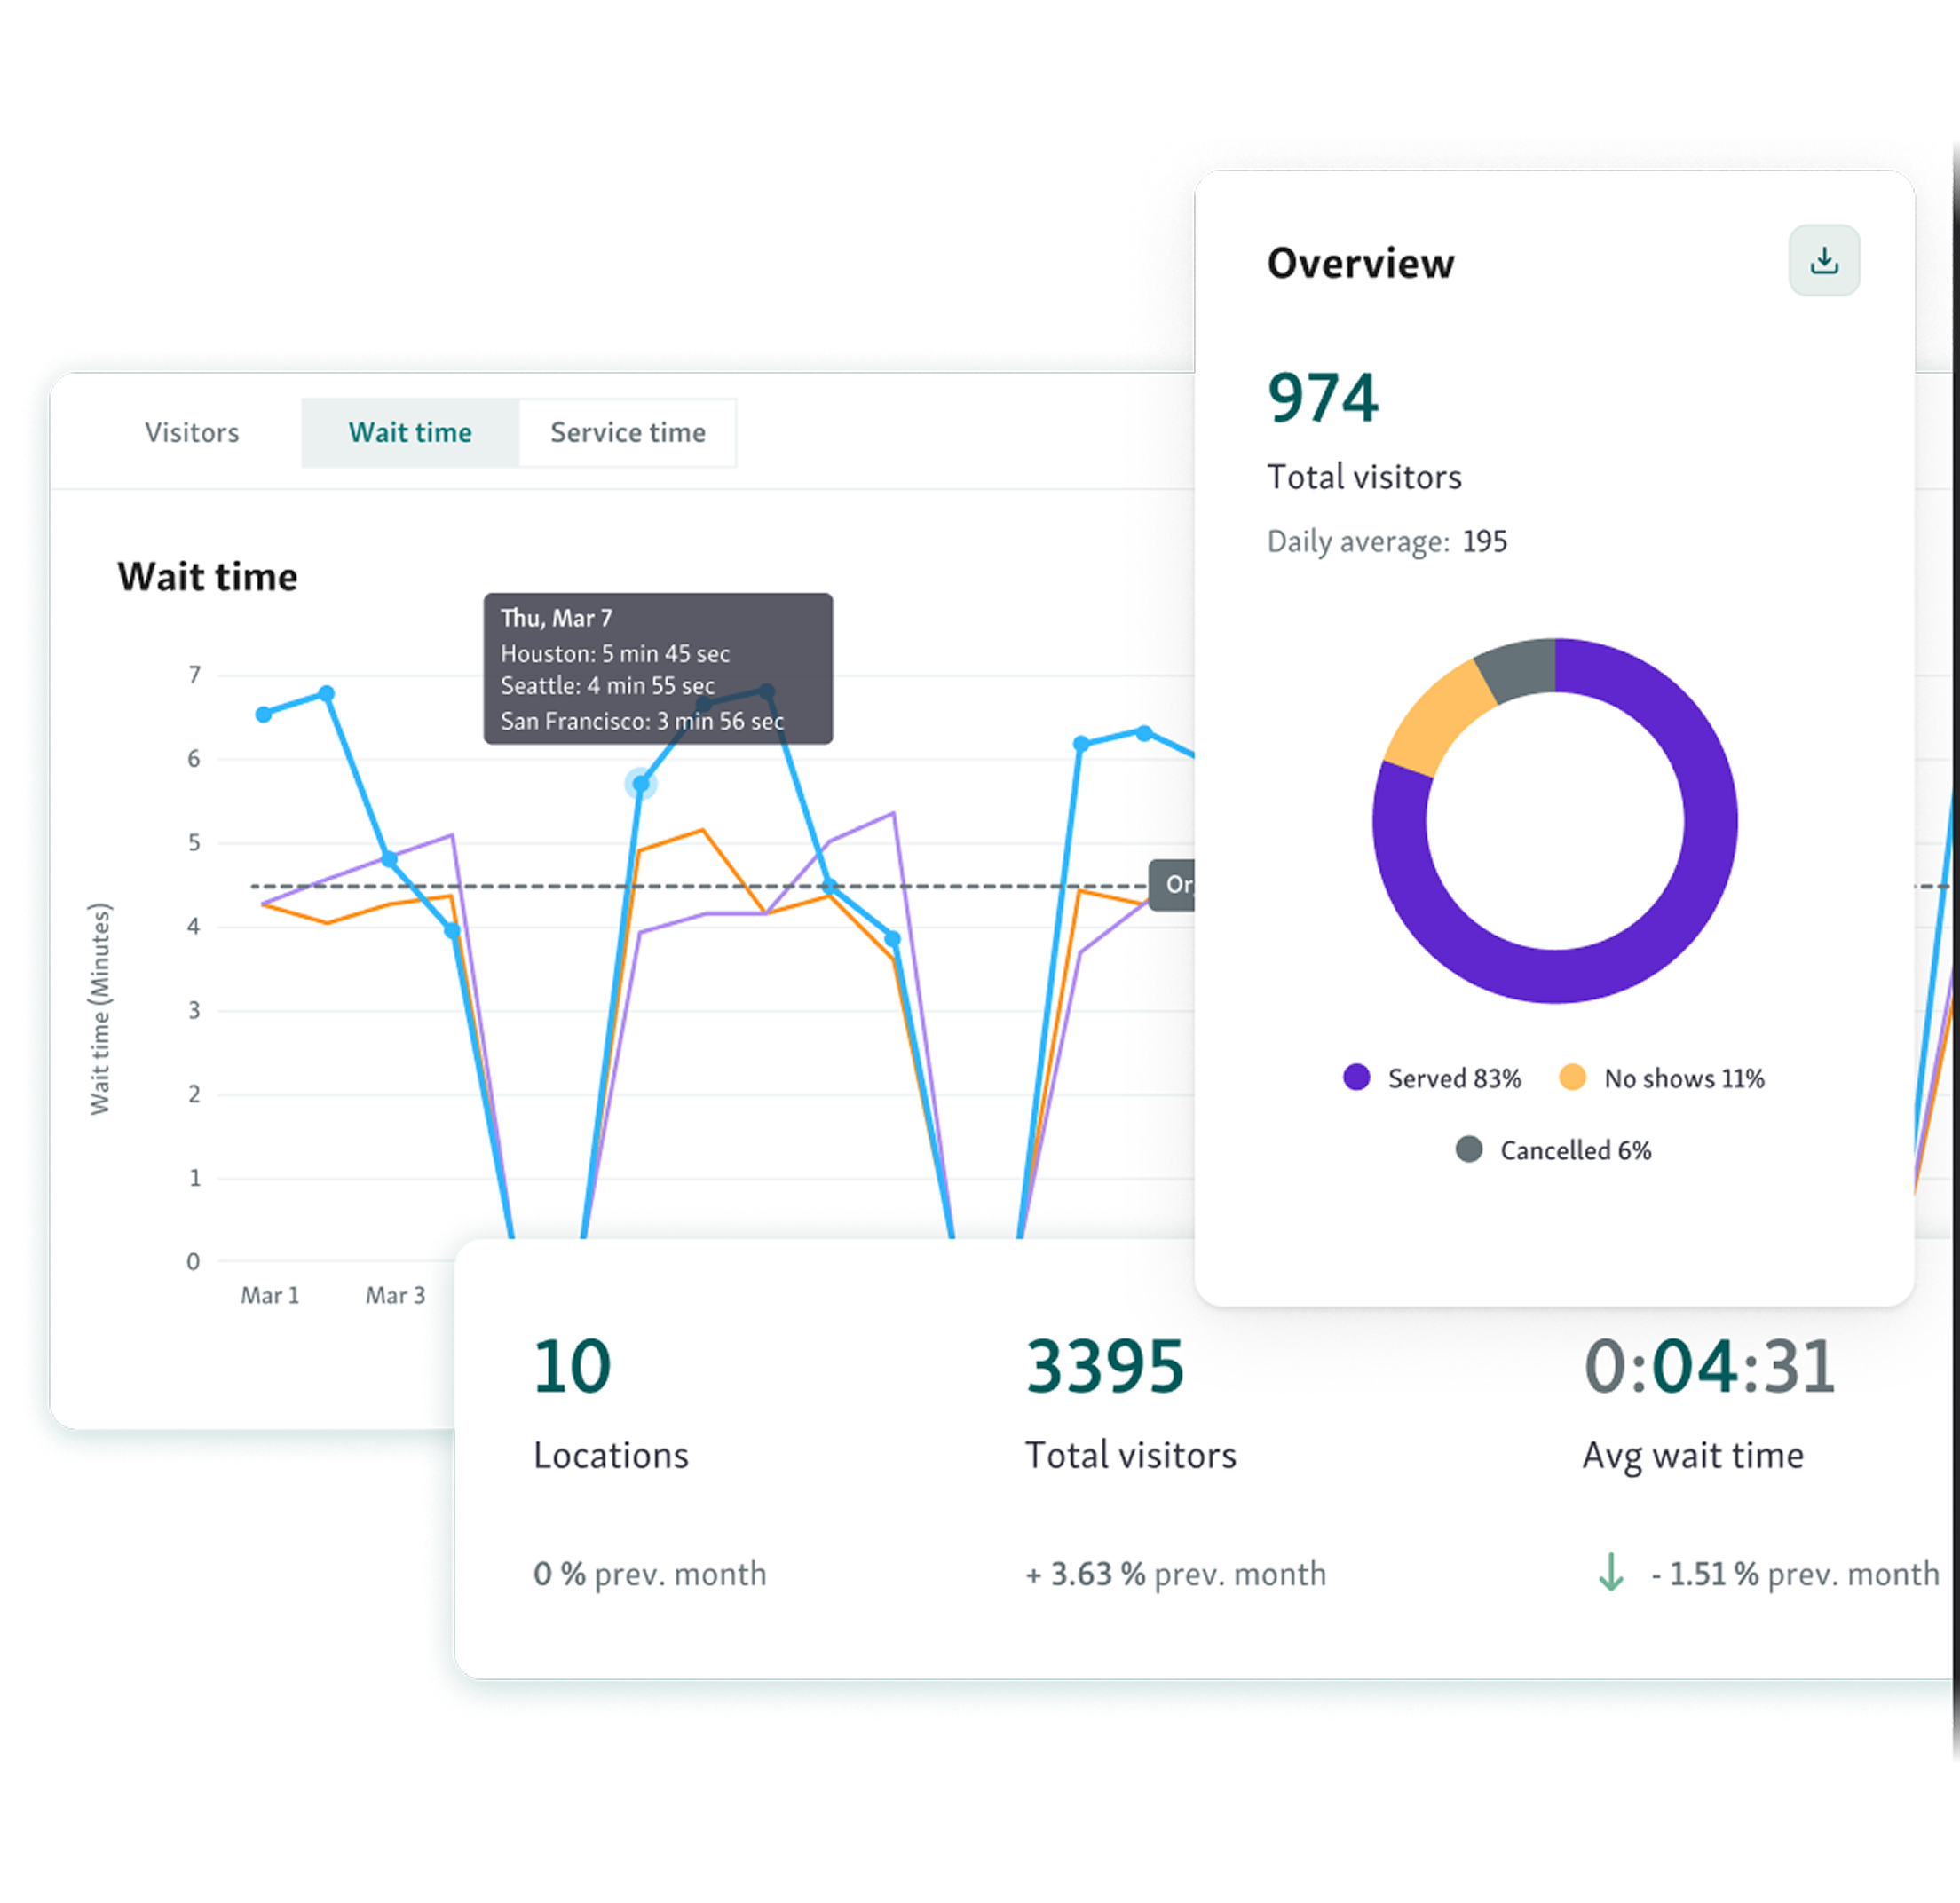
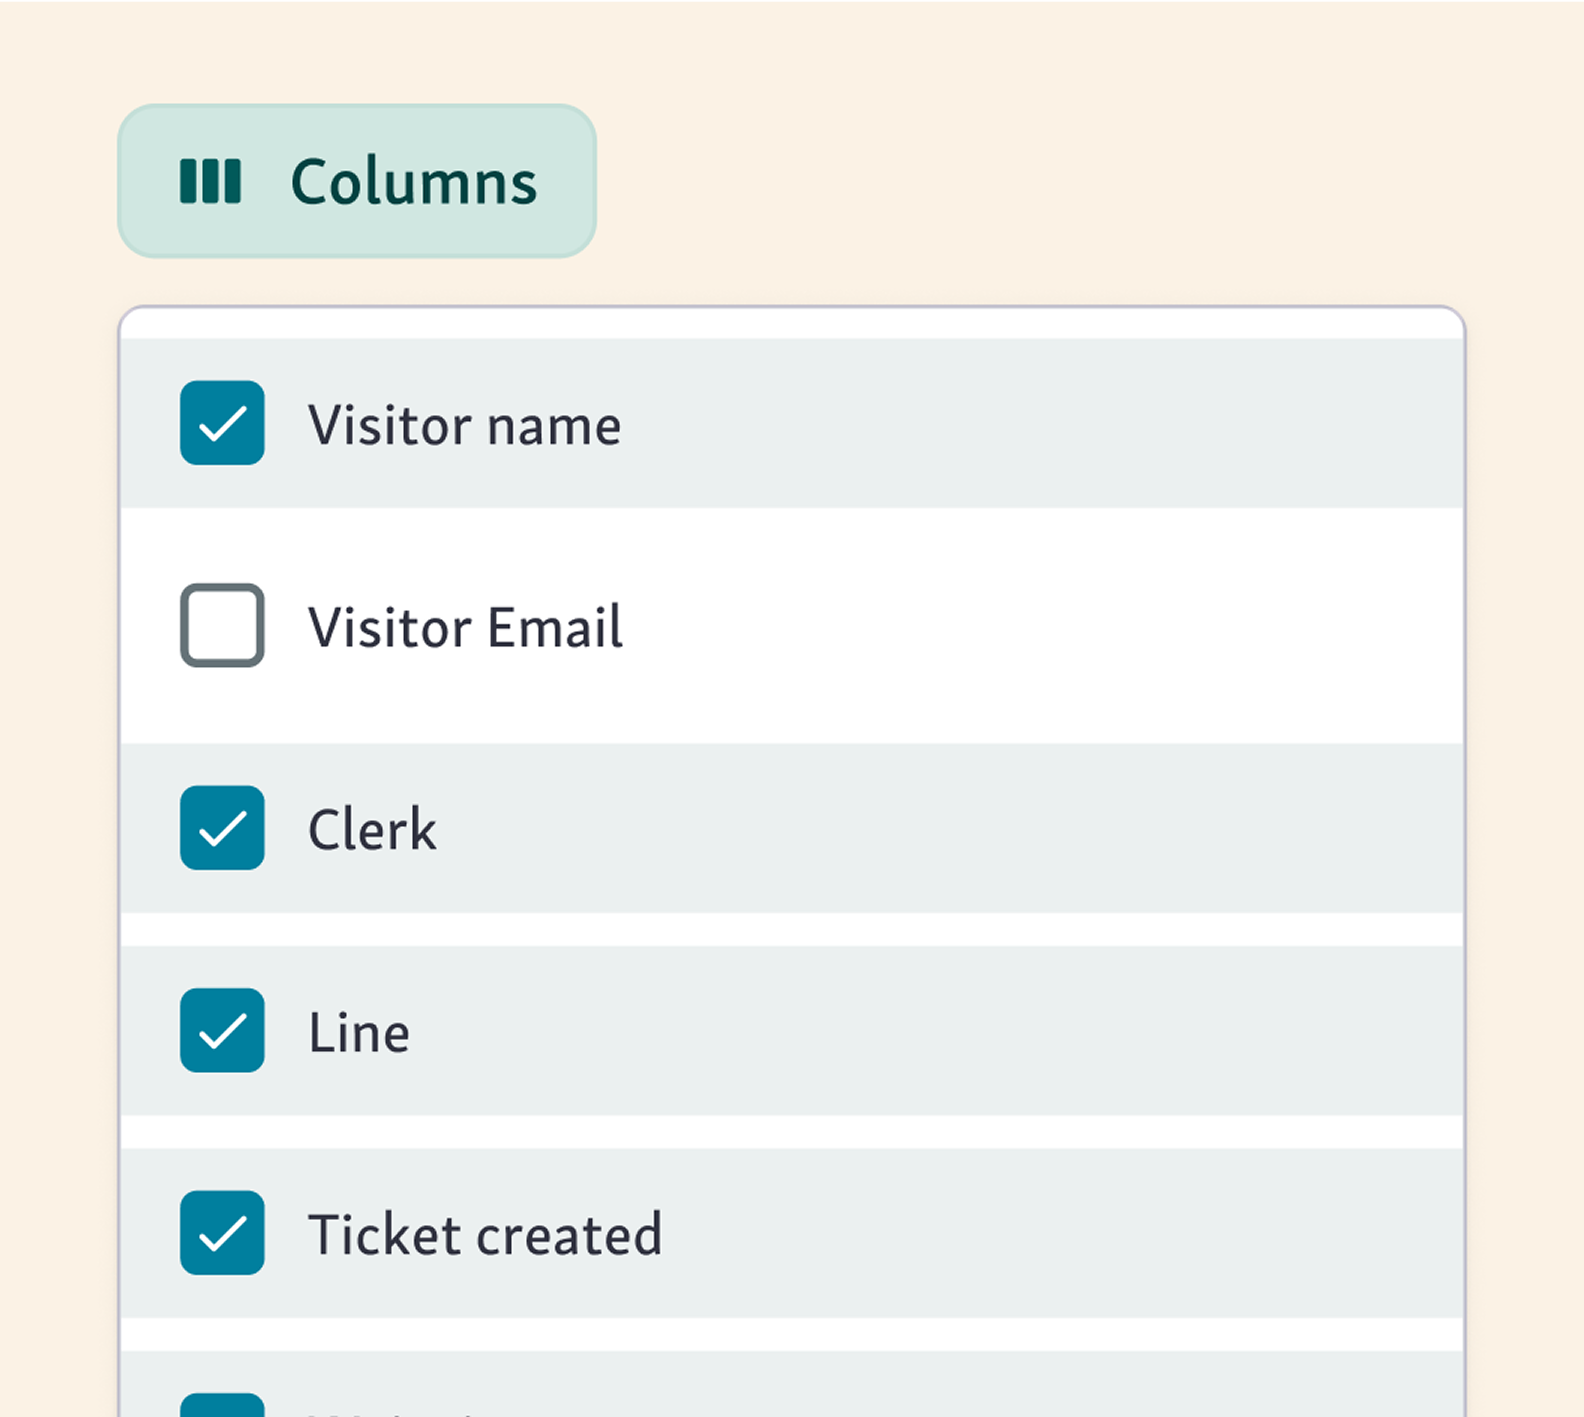
The analytics dashboard for customer service has a number of filters to enable you to see exactly what you need to know to make strategic decisions.
Filter by location, period, clerk, service line, wait time start, waiting time, service time, live status.
Add any other custom field so you can perform even deeper analysis
Export it all to Excel with a single click
One part of our Service Intelligence platform
Analytics software is part of the Qminder platform, which enables you to interact with visitors in new ways and create a more efficient visitor and registration process.
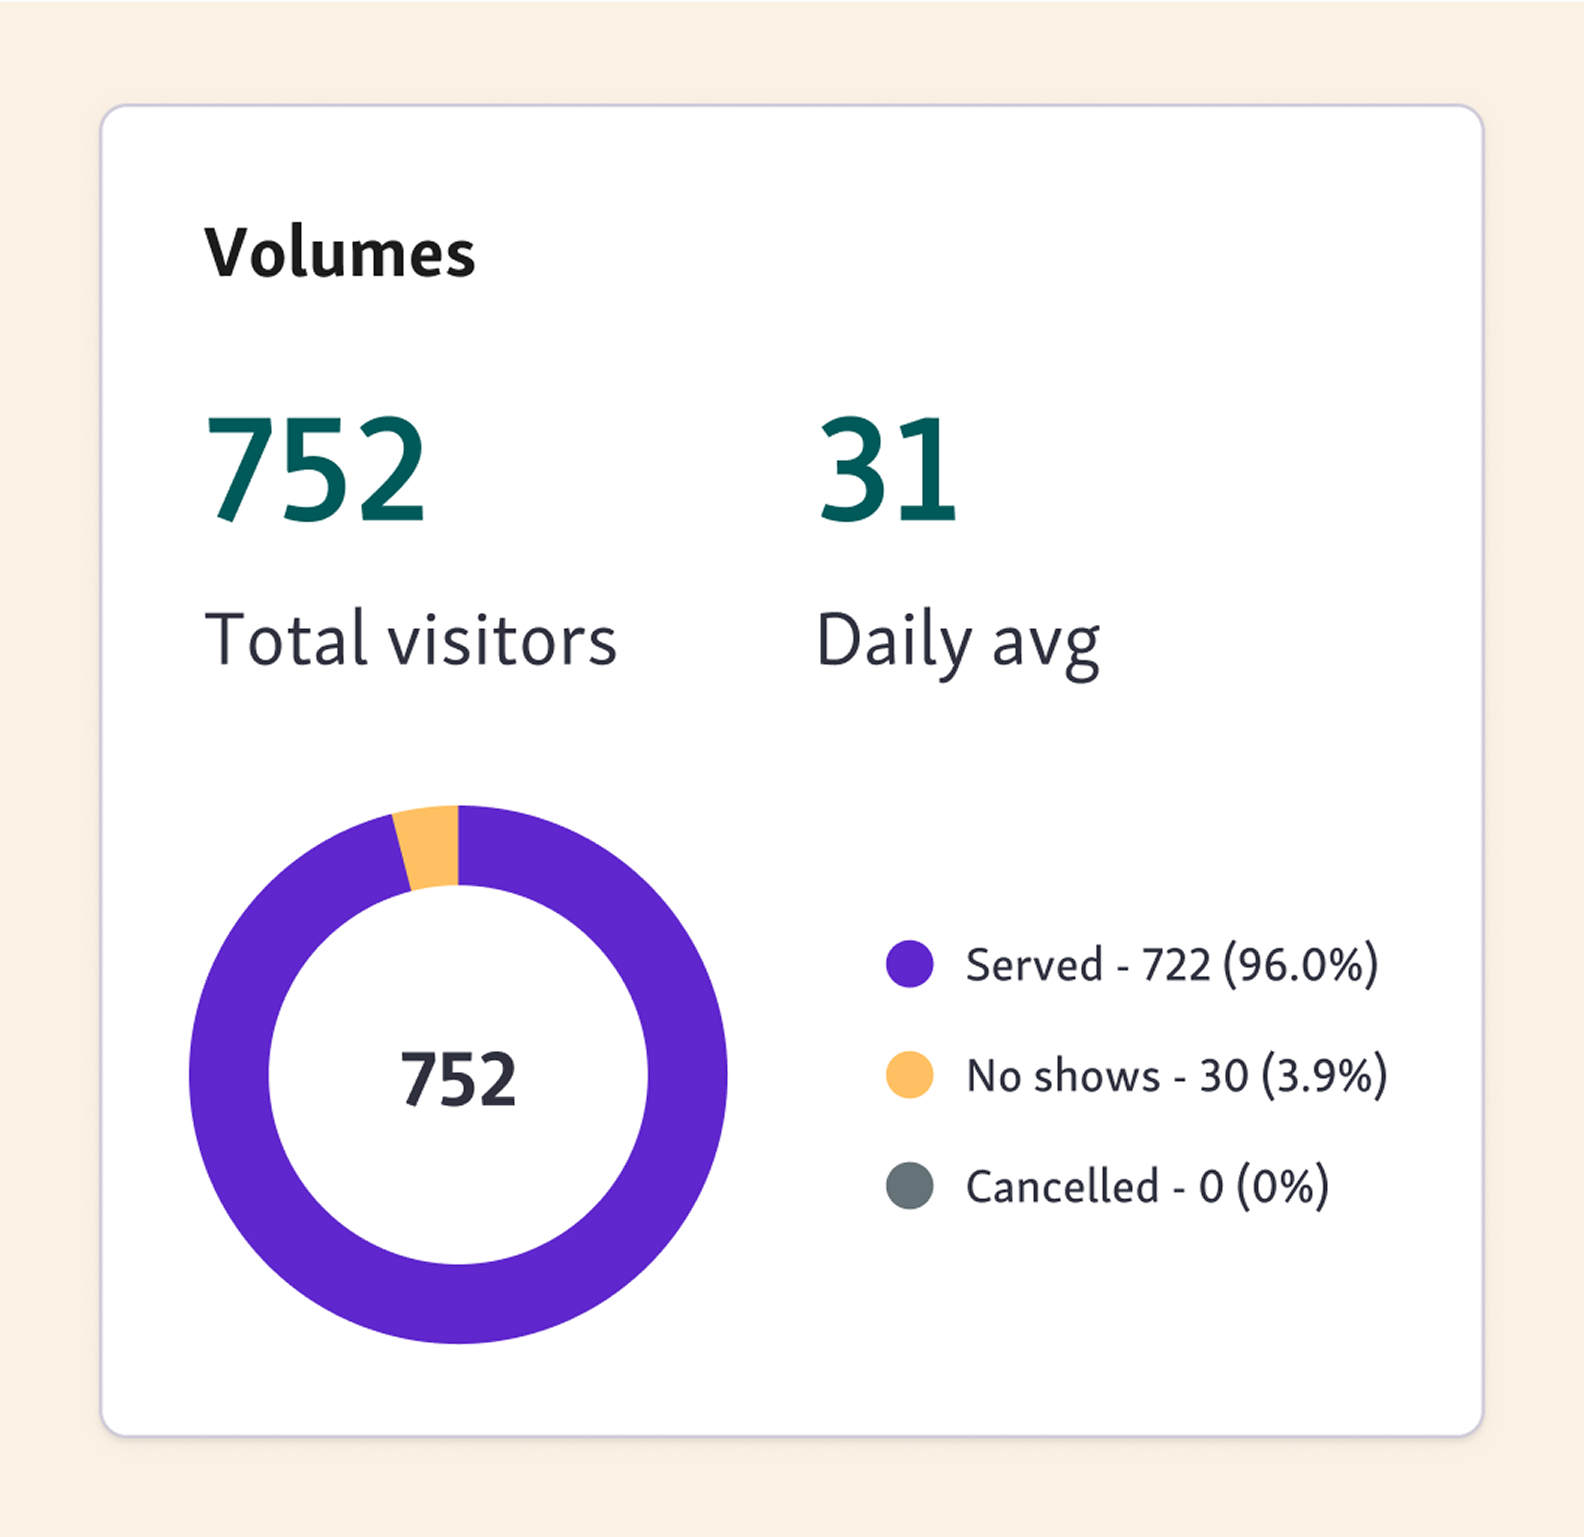
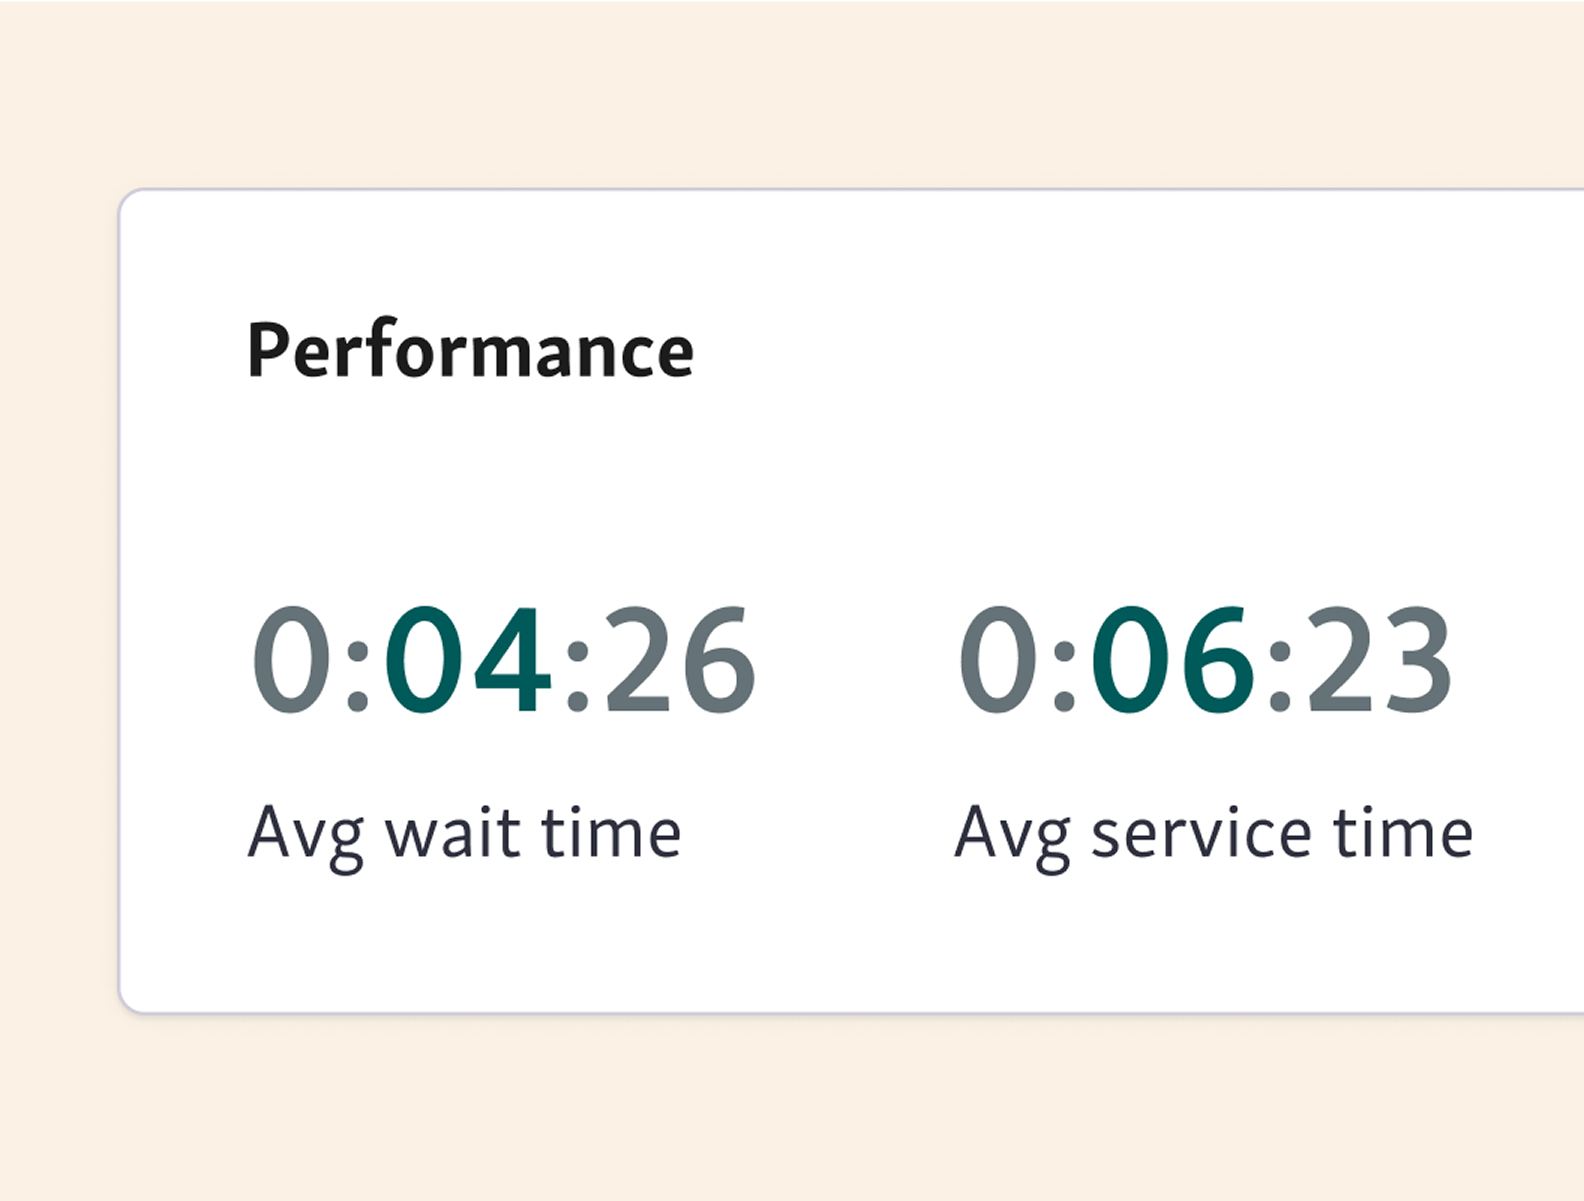
Review average wait and service times, volumes, no shows, daily and hourly visitors, and more with our customer service workforce analytics.
Enable clerks to orchestrate a more efficient service with our Service Dashboard .
Give visitors the power to show up prepared and on-time with two-way customer messaging , visitor website and more.
The outcomes our customers see
The importance of customer service analytics cannot be understated. Teams use the feature to help serve more visitors, reduce waiting times and create a better experience for visitors and service teams.
For more insight on how we can upgrade your analytics experience, check out our City of Torrance case study .
Included in all our packages
Our customer service data analytics is integrated with our platform, so you benefit from all the usual perks of partnering with Qminder:
A couple more perks you should know about:
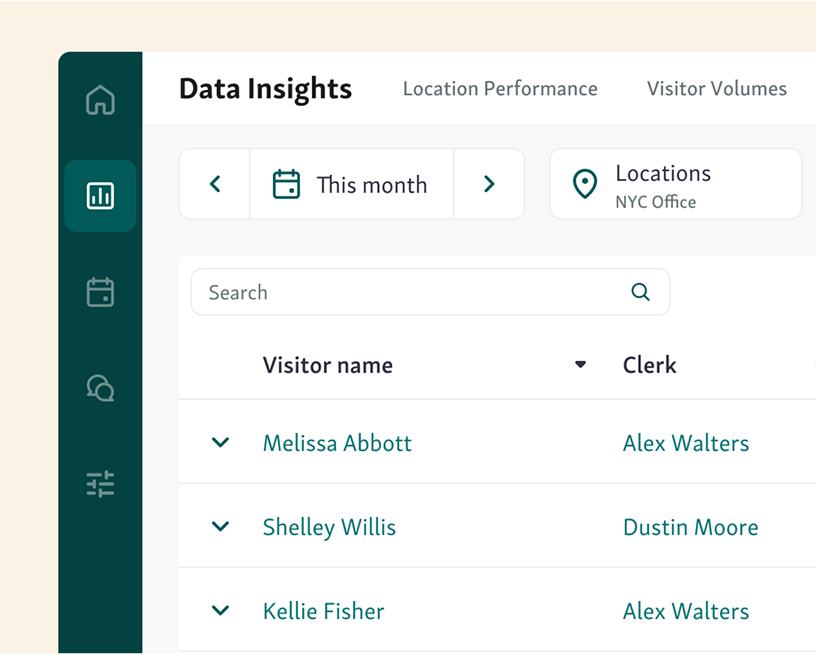
See how service performance impacts individuals
Your visitor history will give you a quick overview of your customers
Includes names and sign up, waiting and service times
Visible to both clerks and managers
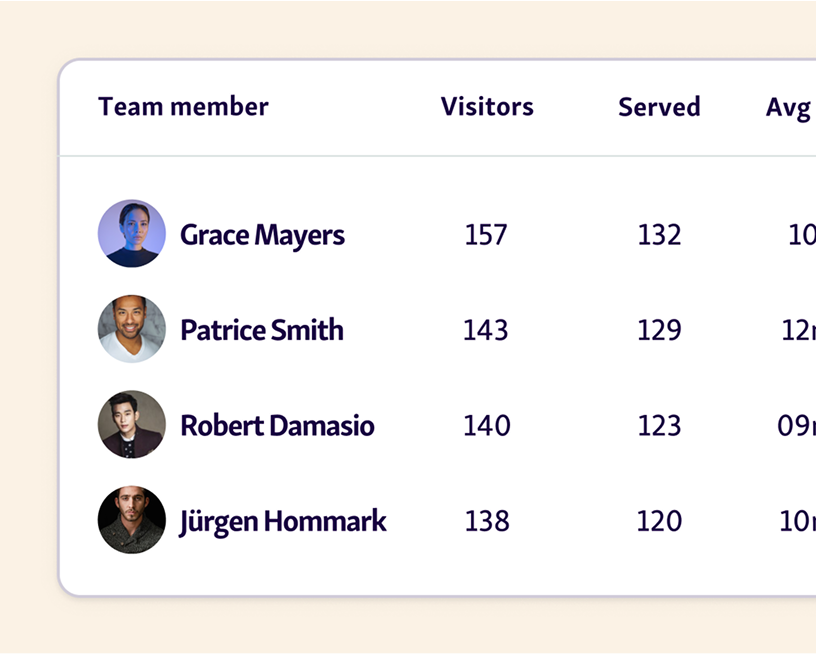
Clerks benefit from analytics too
Clerks can see today’s summary and visitor history
Help pinpoint rush hours, busiest days and bottlenecks
Enable clerks to personalize service for visitors
FAQ
By spotting bottlenecks or underperforming locations, teams or individuals, you can find new focus areas for improvement that will directly impact wait times and the customer experience.
Also with custom Input fields, you can ask visitors for any information you need during check-in. You can then review this information in an aggregate view to judge how your teams can adapt to better serve your customers.
By reviewing peak traffic hours and average handling times , you can:
Optimize staff schedules
Reduce idle time
Plan better coverage during busy hours
Minimize visitor wait times
No more guesswork. Just data-backed decisions.
You can generate daily, weekly, and monthly performance reports across teams, locations, and service lines.
These include metrics like:
Visitor volumes
Average wait and service times
No-show rates
Peak hours and downtimes
Clerk-specific and team-wide performance
Access is role-based:
Managers can view team and location-level performance
Regional managers can compare branches from a master view
Clerks see today’s stats and historical visitor data for personalized service
You control access levels to keep sensitive data secure and ensure the right people have the right insights.
Yes. Qminder’s analytics dashboard includes customizable filters like:
Location
Service line
Clerk
Wait or service time
Visitor status (waiting, served, no-show)
You can also add custom input fields (like visit reason or department) for even deeper analysis.
Absolutely. Qminder is designed for easy scalability, allowing you to manage multiple departments and locations within a single platform.
This enables you to access aggregated data of performance across the board, enabling you to compare locations and the success of different service flows.
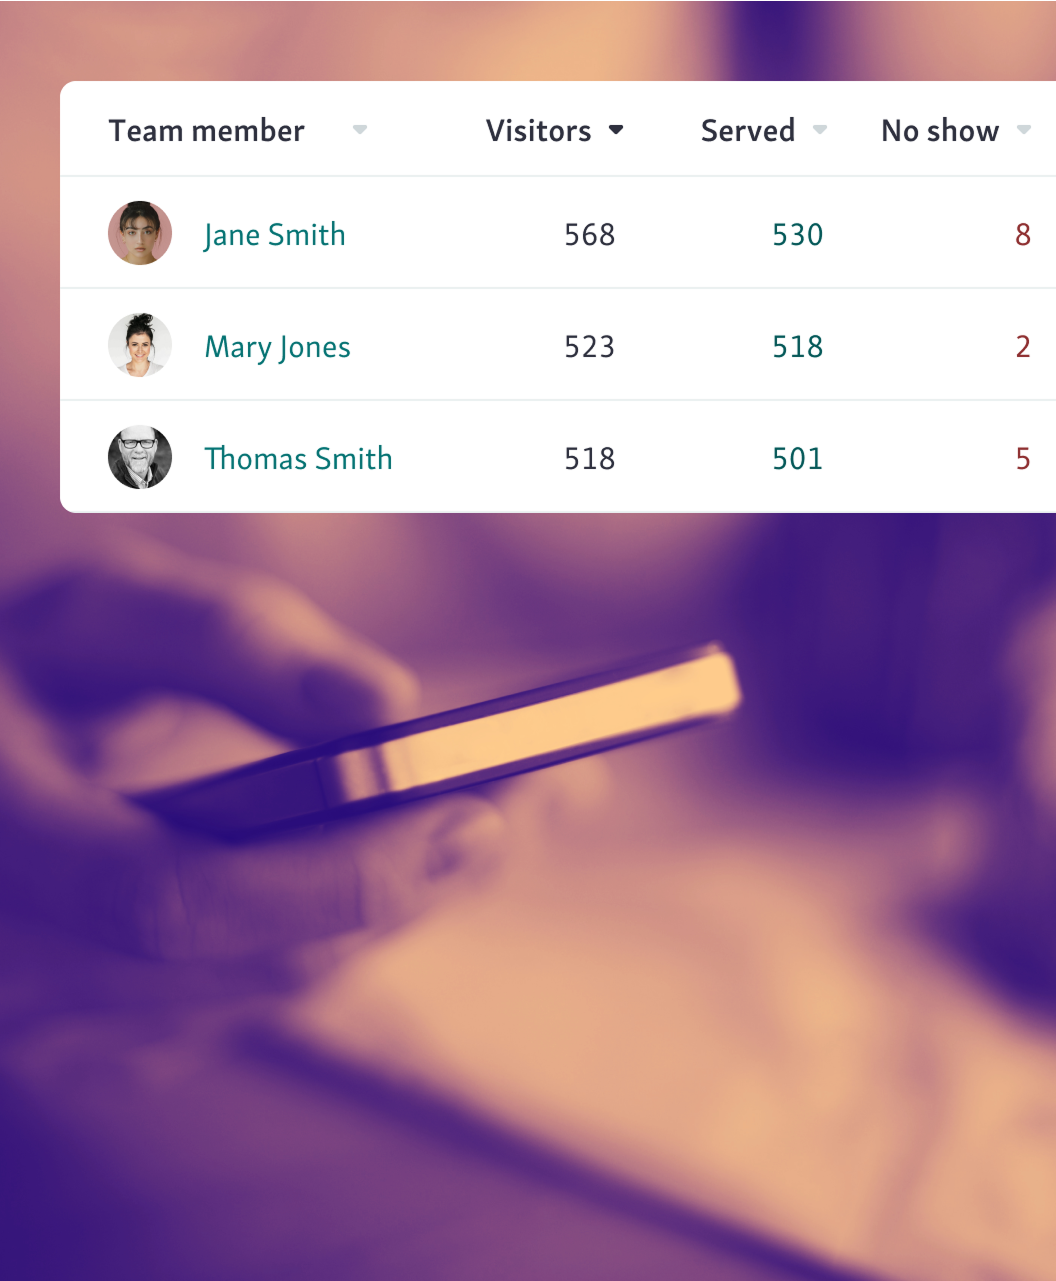
Absolutely. Each clerk’s performance is tracked and visible via:
Leaderboards
Individual service times
Visitor feedback (if enabled)
Historical trends
This helps you identify top performers , offer targeted coaching, and celebrate team wins .
No. Qminder digitizes and automates all processes.
When visitors enter their data, it’s automatically recorded within Qminder. Your staff can access a complete visitor history to help them personalize the service.
Qminder’s Service Intelligence solution also provides real-time data and reports to aid managers and regional managers in decision-making.
If you have a Premium or Enterprise plan, you can configure data retention settings in Qminder. This allows you to define how long a visitor's data will be retained.
Qminder is fully compliant with HIPAA, TX-RAMP, SOC 2 Type II, and GDPR, ensuring the highest data privacy and security standards.
Access controls are in place to limit who can view and manage data, and we conduct regular security audits to safeguard against potential threats.
Yes. Managers and staff can check live performance data from their phones, ideal for:
Real-time insights on the go
Quickly responding to bottlenecks
Staying in the loop without needing a laptop
You can export raw data to Excel and build your own custom reports. Plus, with custom input fields and tag filtering, Qminder adapts to your organization’s unique reporting needs.
