

Paradoxically enough, queue management isn’t the main thing that a queue management system has to offer. It’s actually queue analytics.
We at Qminder have always been saying that poor queue experience is a driver of customer dissatisfaction.
But it’s not enough to simply add a queuing solution to sort out your queues. You need to understand:
What your customers want.
How your employees and locations are performing.
How this performance changes over time.
Queue management is useless without queue management analytics. Data drives improvement in every area of customer service, line management included.
Today, we are taking a peek behind the curtain to show you what makes Qminder the most sophisticated, data-driven queue management solution in the world.
If you’re not using Qminder yet, you can request a free, fully-featured trial below.
Custom input fields and labels
Customer check-in is your first opportunity to gather valuable data. It is important to configure your sign-in process in such a way as to maximize the value you get out of it.
As a data-driven queue management tool, Qminder achieves that through custom input fields and choice-based sign-in flows.
Upon check-in, customers fill out the input fields you’ve chosen for them. Depending on their answers and the logic steps you’ve set up in your check-in flow, they can be automatically added to a specific service line.

This removes the frustration of them not knowing who can solve their questions.
On the other hand, you receive useful data that can be later used in both service and post-service loops.
Customer interaction history and search
An average business can serve a few dozens to several hundreds customers a day. It is impossible to remember each interaction with every customer.
Luckily, a digital queue management system also provides this valuable data.
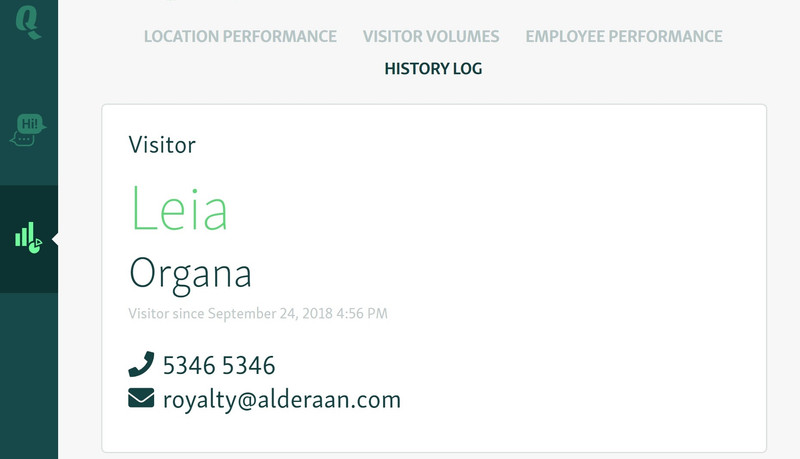
Qminder’s history log is a great tool to see a breakdown of every interaction a customer had with you, including:
Their tickets (service lines they joined, date of check-ins)
Names of all clerks who served them
Wait time and service time metrics for each interaction
Contact information
Added labels
Other service details: forwarding to another queue, cancellation, etc.
Additionally, you can track their SMS chat log to see if the conversation was up to your standards, or record their answers to questions and surveys.

Customer volume and other statistics
Customer volume is one of the more important stats a queue management system keeps track for you.

It doesn’t only consist of the raw number of visitors served a day; it offers you a complete breakdown of customers based on:
Whether they were served, cancelled or didn’t show up.
Which service line they joined.
At which time they showed up (day of the week or the exact hour).
Which channel they used to check in.
This helps you understand the average numbers over a specific time period. In turn, you know exactly the peak hours at your location, the emerging trends in visitor volumes, and possible bottlenecks you need to address.
All of the graphs on this page can also be downloaded as PNG, JPEG, PDF or CSV for use in your reports.
Comparing the performance of service locations
One of the bigger benefits of using Qminder is that it allows you to compare the performance of different branches.
It is important to capture and analyze information that helps measure how well one branch is performing against the other. Businesses want to promise consistent customer service across all locations — underperformance of one location is thus a blemish on all of them.

Qminder lets you compare, at a glance, which of your business locations is lagging behind and which is overperforming in terms of idle time, service time, customer volume, etc.
You can also see the changes compared to last week’s performance, so that you know which trend is here to stay and requires a closer look.
Note: To maximize the value from comparing different locations, you need to configure their check-in setup in a similar manner. Standardized input fields will allow you to compare each location’s performance stats side-by-side.
Team-based and individual performance
On a more granular level, Qminder lets you also compare the performance of your team and individual team members.

Team Performance gives you a succinct summary on how well customer-facing employees are performing.
This page gives you a rundown of:
Overall visitors assigned and served
No-shows and cancellations
Average service time
Total service time
This data can be filtered by line or by period. You can see the performance for the current or last month/week/day, or set a specific date range that interests you.
To get a quick overview of your team’s top performers, you can also sort by each category by clicking on the up-down arrow next to it.
If you wish to get even deeper with your service analysis, you can do so by going to each team member’s page.

Team Member Details page offers a bird’s eye view of how a particular user is performing, giving you their stats over a timeframe and comparing these stats to other members.
Exportable service data reports
You can’t improve what you don’t measure. On a similar note, you can’t report what you don’t export.
With Qminder’s export feature, you can export service data to Excel.

The report includes a complete breakdown of your performance, with three separate sheets for visitors, clerks, and lines.
Any custom input fields or labels that you’ve configured will be included, as well.
Qminder also offers Google Sheets integration that allows you to turn your spreadsheets into streamlined, automated, visually appealing reports.
The report can be easily shared with your team or higher-ups when discussing your service strategy.
Advanced search functionality
With a plethora of data at your disposal, it’s hard to keep track of all of it. That’s why Qminder has developed a robust search feature that allows you to find the data point you need.
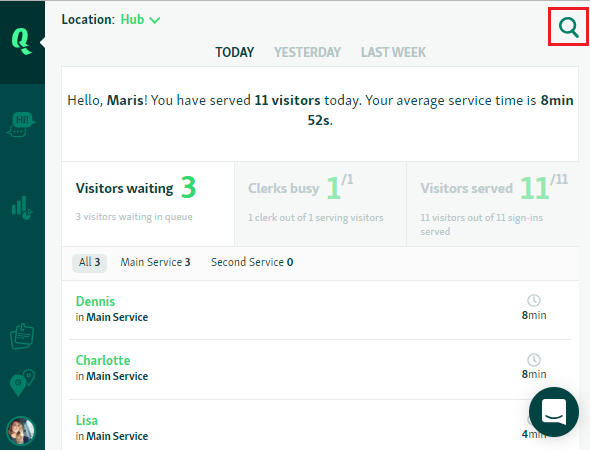
As soon as you start typing, the system begins searching for information.
This can be a location or a specific service line. This can be a ticket or contact details. This can be a particular employee, as well.
As long as Qminder recorded it, you can find it in just a few clicks without wasting time.
APIs and third-party integrations
No queue management software alone — or any software, for that matter — can solve your customer service woes.
If you wish to take your data game to the next level, you need several tools tracking different aspects of your business’s performance.
Third-party integrations using APIs let you get a full picture of how well your team is performing, while at the same time removing information silos that exist between different platforms and departments.
Informed business decisions require accurate, rich data, which is only possible through queue management software working alongside other data-gathering tools.
Qminder offers public APIs and webhooks, as well as premium API support. Qminder can be easily connected to a large swath of systems and databases.
You can feed the information that you get from Qminder to your business intelligence system or CRM. Or, you can integrate waitlists with your digital signage to maximize the value.
The same goes for team performance metrics — they can be used in your existing employee management and staff planning tools.
Get to know our solutions
We will give you a short but great overview of how Qminder can improve your business and visitors experience.
Try out Qminder for yourself and see how we can improve your business and visitors experience.