Service intelligence means using real-time service data, like wait times, foot traffic, and staff performance, to make better decisions. It’s not just about collecting numbers. It’s about turning them into insights that improve how your business runs.
For places that deal with in-person traffic, like clinics, government offices, and retail counters, it is revolutionary. Instead of guessing what’s working, you can see the full picture and act on it.
In this blog, we’ll look at how businesses can use service intelligence to improve customer experience, reduce wait times, and make smarter decisions.
What is Service Intelligence?
Service intelligence is the use of real-time service data to understand and improve customer-facing operations. It focuses on the points where service happens, at the front desk, during check-ins, or when someone is waiting in line.
While Business Intelligence looks at overall performance metrics, service intelligence zooms in on what’s happening during each customer interaction. It connects the dots between operations and experience.
Some common areas where it’s used:
Wait times and queue flow
Visitor check-ins and sign-outs
Staff workload and service duration
Daily or weekly foot traffic patterns
It’s the kind of insight that helps you make everyday service smoother and more efficient.
5 Key Metrics Tracked With Service Intelligence
Service intelligence tracks key performance metrics that show how your team is serving visitors. These insights help improve speed, flow, and overall experience.
Here are the core metrics that give you a clearer view of what’s working and what needs fixing.
1. Wait Time
Wait time is the number of minutes a visitor spends waiting before being helped. It’s the first sign that something’s off in your flow. Long waits often point to short staffing, poor scheduling, or a queue setup that’s not working. Tracking this regularly helps you plan better and give people a smoother visit.
2. Service Time
Service time is the time staff spends helping a customer once service begins. Tracking it helps teams see how long each interaction takes, spot delays, and find ways to work more efficiently. It also gives managers a better picture of how staff time is being used across different service types.
3. Visit Duration
Visit duration measures the full time a customer spends from check-in to the end of service. It includes both the waiting time and the time spent with staff. Looking at the full visit helps spot bottlenecks, compare different service areas, and track how changes in one part of the process affect the rest.
4. No-Shows
No-show tracks how many people booked a slot but didn’t turn up. When the number is high, it points to gaps in your reminder system or booking flow. Fixing this can free up time, cut down on empty slots, and make sure staff aren’t waiting around. It also helps give that time to someone who’s actually present and ready.
5. Staff Handling Time
Staff handling time is the time each staff member spends helping one visitor. If someone is way quicker or slower than the rest, it usually means something’s off. It could be a training gap, or maybe they’re handling more complex cases. Looking at this helps you spot patterns early and keep service steady across the whole team.
How to Optimize Service With Service Intelligence
Service intelligence gives you a clearer view of what’s working and what’s slowing things down. Here’s how to optimize service with service intelligence:
1. Identify Patterns and Fix Bottlenecks
One of the most useful things about service intelligence is how it helps you spot patterns. When you understand when things slow down or get crowded, you can fix them before they become a problem.
Track visitor traffic to predict busy hours
Adjust staffing schedules to match actual demand
Use queue and service duration data to find pain points
Monitor real-time performance to react quickly
Tools like the Qminder service dashboard make it easier to view live activity, spot bottlenecks, and make changes on the fly.
2. Personalize Service at Scale
Service intelligence isn’t just about numbers, it’s about people. When you collect the right data at check-in, you can make service feel more personal, even in high-traffic locations.
Use names and visit history to greet visitors properly
Route people based on their needs or previous visits
Spot repeat visitors and adjust the flow for faster service
Offer more relevant support without asking the same questions twice
The first thing a Qminder check-in kiosk asks from a customer is their name. This allows your employees to call your customers by name, making for a more personal touch.

With tools like Qminder, staff can see who’s waiting, why they’re visiting, and what kind of help they need, all in real time. It makes personalization possible, even during peak hours.
3. Manage Teams With Fair, Data-Based Oversight
Service intelligence gives managers a clear view of how staff are performing—not just overall, but day by day.
Track individual wait times, service durations, and visitor feedback
Spot who’s overloaded and who might need more support
Use real data for coaching, recognition, and shift planning
Avoid bias by basing feedback on actual performance, not guesswork
When everyone knows the system is fair, it builds trust. And when work is balanced across the team, both staff and visitors benefit.
4. Unify Experience Across Locations
For businesses with multiple locations and branches, keeping service consistent can be hard without the right data.
Service intelligence helps compare metrics like wait times and staff performance across locations
Managers can spot which branches need support or which processes work better
Customers get a similar, reliable experience no matter where they visit
Consistency builds trust. With the right tools, you don’t just run each location, you improve all of them together.
5. Make Smarter Decisions, Faster
Good decisions come from good data. Service intelligence gives you the numbers you need to move quickly and confidently.
Use live traffic and wait time data to fine-tune staffing
Spot recurring patterns that show where service can improve
Align marketing, budgeting, and planning with actual performance data
Instead of guessing what’s working, you can measure it. And instead of reacting late, you can stay ahead of problems.
What You Can Analyze With Service Intelligence Tools
Service intelligence gives you a clear view of how things run behind the scenes. Here’s what you can track and use to improve performance:
1. Visitor History
Visitor history gives you a full picture of past visits, right down to the individual level. It helps you review how service was delivered and what patterns are emerging over time. This isn’t just about looking back — it’s about using the data to plan smarter going forward.
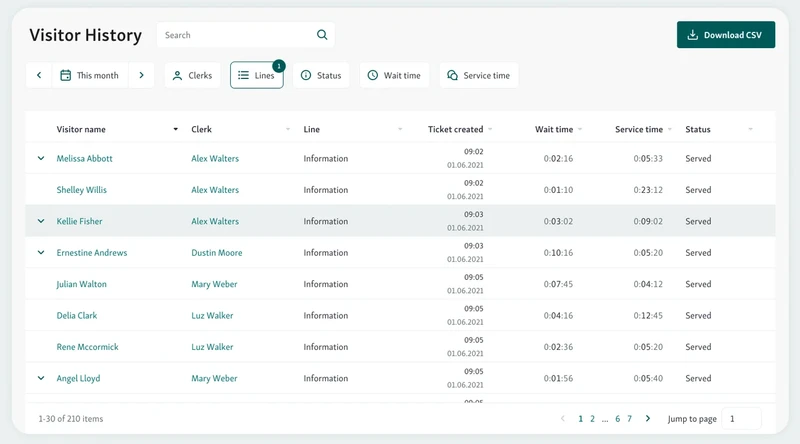
Filter by visit status, time period, or assigned staff
Review custom data fields collected at check-in
Spot repeat visitors or track how certain service types are trending
Use filters to dig into specific queues or locations when needed
With this view, you can quickly answer questions like who was served, when, and how long it took.
2. Employee Performance
Tracking how each team member performs helps you manage staff more fairly and efficiently. It shows who’s handling the most visitors, how long service takes, and where there might be room for support or coaching.
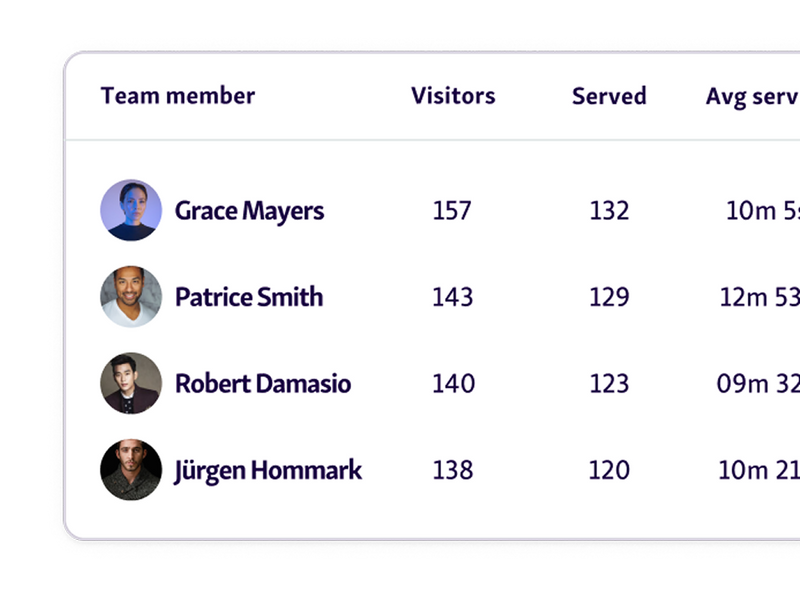
Number of visitors served per staff member
Average service time and total time spent per interaction
Identify staff strengths and support training needs
Use data to balance workload and recognize top performers
These insights are key for planning shifts, setting goals, and improving overall service quality.
3. Location Performance
For multi-location businesses, having a clear view of how each site is doing is important. Service intelligence tools help track location performance at every branch so you can spot what’s working and where things need improvement.
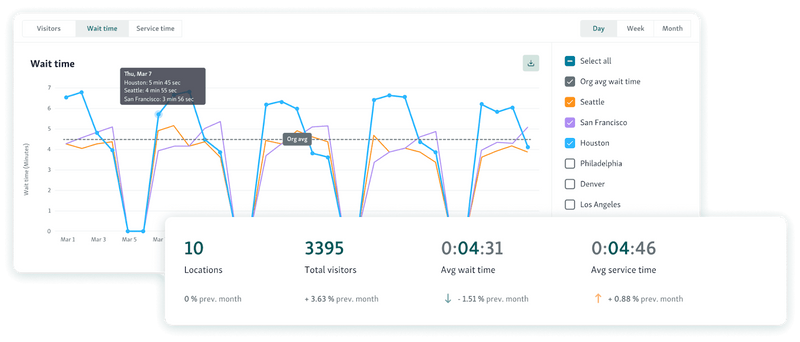
Queue length and how it changes throughout the day
Average waiting time and service time across locations
Charts that break down daily and hourly traffic
Compare performance trends between branches
This helps ensure a consistent experience and gives managers the service analytics they need to make location-specific decisions.
What are the benefits of service intelligence?
Service intelligence is more than just data. It helps you work smarter, improve team flow, and deliver a smoother experience across the board. Here are some of the benefits:
1. Boost Staff Efficiency and Morale
It’s not just about having more people on the floor. It’s about placing the right staff at the right time. Service intelligence helps spot peak hours so managers can plan shifts better. This means fewer people getting overwhelmed and less idle time during slower periods. When workloads feel fair, morale goes up, and service quality follows.
2. Deliver Personalized, Human-Centered Service
Service shouldn’t feel robotic. When teams have access to check-in names, visit history, and reason for visit, they can make each interaction feel more thoughtful. No need to ask repeat questions or guess what someone needs. It’s a small shift, but it helps people feel seen. Over time, it builds trust and improves the way your team connects with visitors.
3. Reduce Customer Wait and Frustration
Nobody likes waiting around with no idea when their turn will come. Service intelligence helps fix that. It gives your team the visibility to spot delays early, balance out the work, and keep visitors informed in real time. This kind of simple communication makes a big difference. Shorter waits. Fewer complaints. A smoother waiting experience all around.
4. Align Operations Across Teams and Locations
When service varies from one location to another, it shows. Service intelligence helps bring everyone onto the same page. It lets you track performance across branches, spot where things are falling behind, and make sure every team is meeting the same standard. Whether you run two locations or twenty, it keeps things consistent and easier to manage.
Take the Guesswork Out of Service Operations
Data-backed service decisions lead to better staff management, smoother visitor journeys, and stronger business results. Service intelligence doesn’t just tell you what’s happening—it shows you where to act.
From spotting bottlenecks to improving team performance, it brings clarity to day-to-day operations and long-term planning. And when it’s paired with the right tool, the impact is even greater.
Qminder makes it easy to track, analyze, and act on your service data across locations. Try Qminder and see how service intelligence can work for you.
They can help any business serving clients face-to-face, but such sources have proven especially useful in high-traffic environments, namely hospitals, government offices, banks, and retail locations.
No. Most modern platforms run on the cloud and are user-friendly. Easy tools such as Qminder can be set up in a plug-and-play manner needing very little setup and minimal IT alignment.
Yes. Real-time data may be used for a faster response from teams to either pull their resources and rapidly allocate them in a few different lines of service to cope with the sudden influx of foot traffic.
Get to know our solutions
We will give you a short but great overview of how Qminder can improve your business and visitors experience.
Try out Qminder for yourself and see how we can improve your business and visitors experience.