Citizens today expect more from public services. Long wait times, complex forms, and unclear processes no longer cut it. People want services that are fast, easy to use, and built around their needs.
But to make that happen, government agencies need to understand how citizens actually behave, not just what the process looks like on paper.
That’s where customer behavior data comes in. It shows when people are most likely to visit, what services they use most, and where they tend to get stuck. In fact, 70% of public agencies using behavior data report faster response times and better service efficiency.
In this blog, we’ll look at how behavior data helps streamline public services and improve service efficiency across departments.
What Is Customer Behavior Data and Why It Matters in Public Services
Customer behaviour data in public services includes details like check-in times, service durations, no-shows, and how people access services, whether through kiosks, apps, or websites. It helps agencies see what’s really happening, not just what’s planned on paper.
Sources of this data include:
Queue management systems
Online forms and mobile apps
Post-service surveys
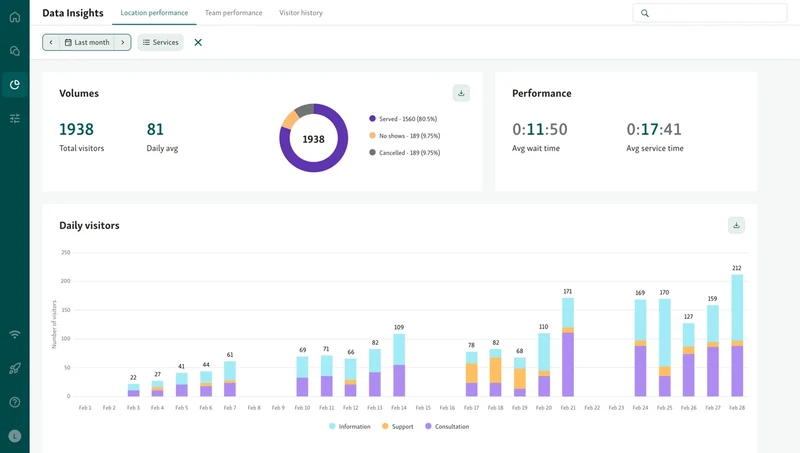
On the other hand, behavior analytics for customer service turns raw data into insight. It shows when citizens usually visit, which services take the longest, and where delays often happen.
Some common patterns agencies uncover with customer behavior analysis:
Peaks in foot traffic during lunch hours
High no-show rates on Monday mornings
Longer service times for certain request types
This kind of visibility helps teams adjust staffing, streamline steps, and improve the overall experience.
How to Apply Customer Behavior Analysis to Improve Government Services
Understanding how people move through your services helps you spot what’s working and what’s not. Here's what works.
1. Predict and Manage Citizen Demand
When agencies know how people use services, they can plan better. Behavior data helps spot patterns like when people visit most, how long services take, and where delays usually happen.
Take a DMV, for example. If data shows that license renewals spike before public holidays, that’s something you can prepare for. You can bring in more staff, adjust shift timings, or spread out appointments through the week.

Some helpful data points to track:
Peak visit times: Know which hours get the most foot traffic. Use that to balance appointments and walk-ins more evenly.
Service-specific patterns: Some services take longer than others. If renewals usually slow things down, plan extra help for those counters.
Appointment behavior: If no-shows go up on certain days, it’s worth sending more reminders or limiting slots during those hours.
Seasonal trends: Watch for predictable spikes around tax season, school enrollments, or the end of the year.
Once you understand when and why traffic builds up, it becomes easier to act early and keep things moving. This saves time for both staff and citizens.
2. Personalize Services Based on Visit History
When someone visits more than once, their experience shouldn’t start from scratch each time. Behavior data can show what services they’ve used before. That helps staff know exactly how to assist without wasting time.
Let’s say a citizen often comes in for housing support. Instead of asking the same questions again, staff can look at their past visit data and pick up right where things left off.
Here’s how it helps:
Spot repeat visitors. Group people by visit frequency or service type. That gives you a better picture of their needs.
Skip unnecessary steps. If it’s a regular request, guide them directly to the right counter.
Save time on forms. No need to fill out the same info every visit. Use what’s already there.
This keeps the experience smooth for both sides. People feel recognized. Staff can work faster. And services run better overall.
Read also - 5 Ways to Enhance Customer Experience in Government Services Like DMVs and City Halls
3. Create Smarter Routing Paths
When people visit public offices, they don’t always know where to go. That’s where customer behavior data can help. It shows patterns across different services and makes it easier to plan better routes.
For example, if a person comes in for license renewal and often asks about address changes, those two services can be grouped together. Instead of sending them to two separate desks, you combine the steps into one smooth visit.
Here’s what that could look like:
Group related services. If two services are often used back-to-back, handle them in one go.
Match citizens with the right staff. Use past visits to route them to agents who know how to help faster.
Cut down waiting steps. Avoid sending people to multiple counters when one will do.
It’s a small change, but it keeps lines moving, shortens wait times, and improves the overall experience.
4. Optimize Wait Times in Real Time
Long waits frustrate everyone. But they’re not always easy to predict, unless you’re tracking behavior as it happens. That’s where combining a customer flow management system with real-time behavior data makes a difference.
Instead of guessing when things will get busy, staff can see it live. If one counter starts falling behind or a sudden rush comes in, managers can respond right away.
Here’s how it helps:
Spot delays early. Real-time data shows where lines are growing or services are slowing down.
Shift resources quickly. Extra staff can step in where needed to ease the pressure.
Balance the workload. Spread visitors across counters or time slots to avoid backlogs.
These quick moves keep services running smoothly and help citizens get in and out faster.
Helpful read - 7 Key Strategies for Efficient Resource Allocation in Local Government Services
5. Design Better Service Hours and Channels
Not everyone visits in person. Some prefer online check-ins. Others call. And some show up early in the morning, while others wait until the last minute. By looking at behavior trends, agencies can make smarter decisions about when and how to offer services.
If the data shows more online activity around lunchtime, that’s a clear sign to offer extra digital support during those hours. If certain services get more foot traffic on weekends, adjusting in-person hours might help ease the pressure during the week.
Here’s how behavior data helps:
Adjust operating hours. Open earlier or stay open later when demand is high.
Expand digital channels. Offer chat, video calls, or mobile support when in-person visits drop.
Match services to preferences. Let citizens choose the channel that works best for them, without extra steps.
It’s all about meeting people where they are, and making services easier to access.
Tools for Gathering and Analyzing Customer Behavior Data
To improve service, you first need to understand how people move through it. That means tracking their journey, start to finish. Not just how long they wait, but what steps they take, where they pause, and when they leave.
This is where behavior data tools come in. The right ones don’t just collect information—they help staff make decisions in real time.
1. Queue Management and Check-In Systems
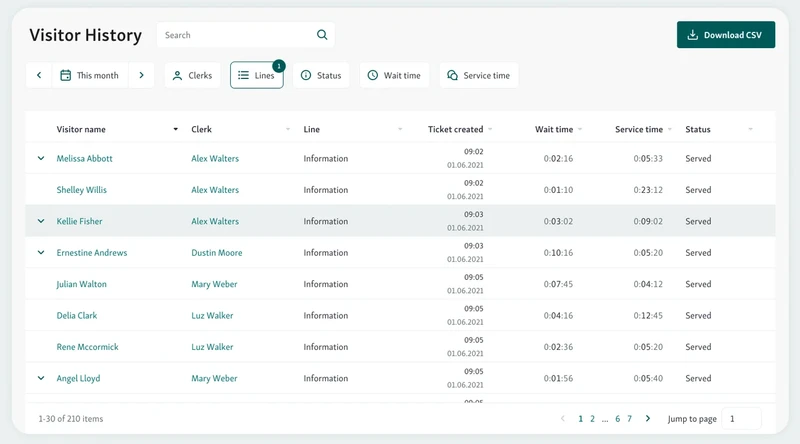
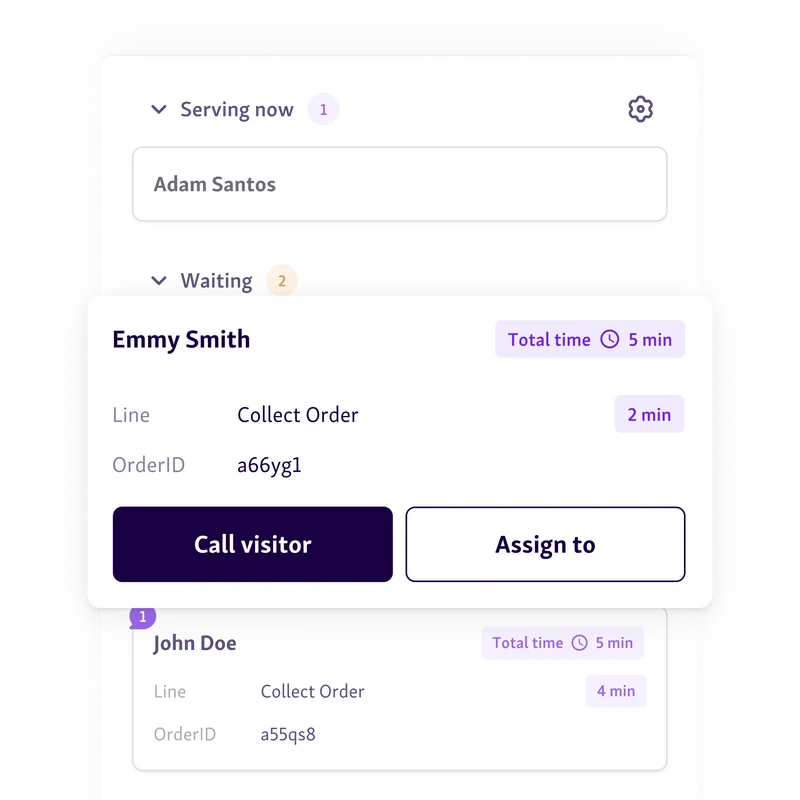
Queue and check-in systems do more than manage lines. They show how people use your service each day. With a public sector queue management system like Qminder, this data becomes easy to access and act on.
Track every step of the visit. From when someone checks in to when they’re served, tools like Qminder capture key details like wait times, service duration, and drop-offs.
Spot problems early. Staff can see where delays are starting to build and shift resources before things get worse.
See what’s working. Over time, patterns become clear, busy days, high-demand services, and which teams are handling the most volume.
Act in the moment. Real-time dashboards help staff adjust on the fly, whether it’s reassigning agents or opening another counter.
2. Surveys and Feedback Loops
Behavior data isn’t just about tracking what people do. It’s also about hearing what they think. That’s where surveys come in.
When done right, post-visit surveys can give context to the numbers. They show you not just when someone left, but why they left feeling frustrated, or satisfied.
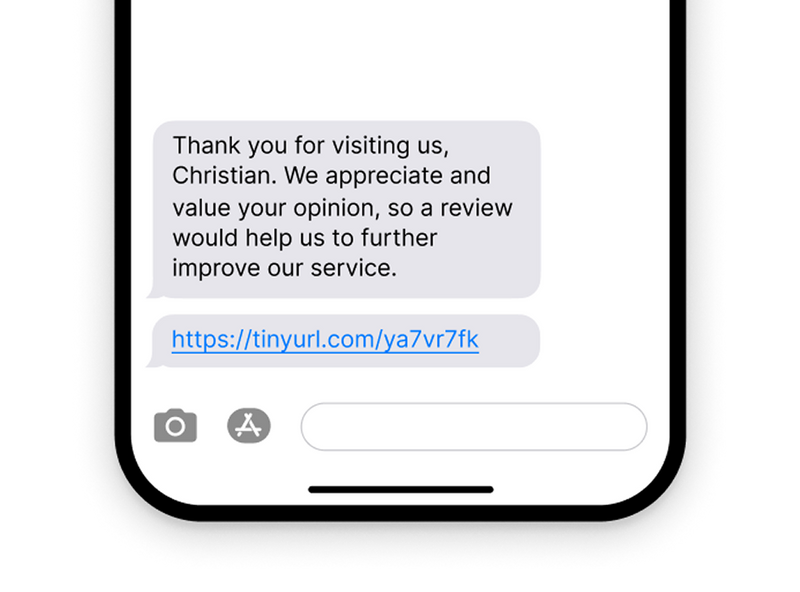
Send short surveys after each visit. Ask about the experience while it’s still fresh. Keep the questions focused on key moments like check-in, wait time, and staff interaction.
Look for patterns in comments. When people mention the same issue more than once, it’s usually worth fixing.
Use scores to track improvement. Simple customer experience metrics like satisfaction ratings or “How easy was your visit?” can help you measure progress over time.
Keep the loop open. Let citizens know their feedback leads to action. This builds trust and encourages more honest responses in the future.
3. Combining Quantitative and Qualitative Insights
Numbers tell you what’s happening. Feedback tells you why. When you put both together, you get better answers.
For example, say a clinic notices patients are dropping off at a certain hallway. That’s the data. But it’s the comments in the surveys that reveal the real issue, people couldn’t find where to go.
So what did they do? They improved their signage. No tech overhaul, no big investment. Just a small change based on a clearer view of the problem.
This mix of insights and real voices is where the real value lies. Use behavior analytics data to spot patterns. Use feedback to understand them. When you bring both sides together, your decisions get sharper, and more human.
Also read - Best Queue Management Systems
Turning Insights Into Better Public Service
Improving government services starts with understanding how people actually use them. Behavior data shows you what’s working, what’s not, and where things slow down. From smarter routing to better service hours, every change begins with the right insight. And when you combine that with real feedback, you get a full picture of the citizen experience.
Tools like Qminder make it easy to collect, track, and act on this data in real time. If you're ready to simplify your service flow and improve citizen satisfaction,
Qminder can help. Book a demo to see it in action.
Customer behavior data tells us about how people move through our services and how they interact with them, including things like arrival patterns, no-show rates and check-in patterns. Service performance data is more about staff output, including the time taken to serve someone and the number of people served in a day.
Yes. Over time, trends can help make decisions that include when to open new service locations, when to open and close locations, and when to provide self-service options. For example, if you have data showing slow, steady growth in mobile check-ins, it might be a good time to invest in additional digital-first tools.
Start simple. Even basic tools like digital sign-ins, manual surveys, or a small queue management system can reveal patterns. Over time, layering in analytics tools like Qminder helps scale those insights into broader improvements.
Get to know our solutions
We will give you a short but great overview of how Qminder can improve your business and visitors experience.
Try out Qminder for yourself and see how we can improve your business and visitors experience.