

Public sector services generate more data than ever before. Wait times, service volumes, no-shows, staffing levels, and citizen feedback all play a role in how agencies measure performance. But in the public service sector, having data doesn’t automatically lead to better decisions. How that data is interpreted matters just as much.
Many public sector agencies fall into common traps when reviewing service metrics. They focus on the wrong numbers, miss important context, or draw conclusions that don’t reflect what’s actually happening on the front line. These mistakes to avoid can lead to poor staffing decisions, frustrated citizens, and wasted resources.
This guide breaks down the most common mistakes to avoid when interpreting public sector services data, so teams can turn information into insight instead of confusion.
Mistake #1: Focusing Only on Averages
In public sector services, focusing only on averages can lead to misinterpretation of service performance. For example, average wait times might appear acceptable at a surface level, but these numbers can hide variations, such as longer wait times during peak hours or for certain services.
The reliance on averages can mask outliers and fluctuations, leaving operational inefficiencies unaddressed. Understanding these variations requires looking deeper into the distribution of wait times, identifying both the best and worst-case scenarios.
Without this, management may overlook serious service gaps that impact the citizen experience.
How to Avoid It:
Use Percentile Analysis: Look beyond averages by considering percentiles (e.g., 90th percentile wait time) to understand both best and worst outcomes.
Focus on Peak Hours: Identify patterns in high-demand periods to ensure staffing levels meet service demand.
Deploy Real-Time Dashboards: Use dashboards to track live data and spot emerging service issues before they escalate.
Monitor Outliers: Keep an eye on extreme cases to see how they impact overall service delivery.

Mistake #2: Ignoring Context Behind the Numbers
In public sector services, data is not always straightforward. A sudden spike or drop in wait times or service volume can be misinterpreted as a performance issue, when in reality, it might be due to external factors like seasonal demand, policy changes, or local events.
For example, a higher-than-usual demand for services during the holiday season may cause longer wait times, but this does not necessarily indicate inefficiency.
Ignoring these external factors when analyzing data can lead to hasty decisions and misguided improvements, which ultimately don't address the real root causes.
How to Avoid It:
Track External Factors: Always factor in seasonal trends, local events, and policy changes when reviewing performance data.
Analyze Long-Term Trends: Use analytics and reporting tools to identify patterns over a longer period to distinguish between short-term fluctuations and real performance changes.
Seek Root Causes: Investigate spikes or drops to identify underlying factors and avoid knee-jerk reactions that don't address the bigger picture.
Communicate with Teams: Ensure frontline staff and managers provide context when reporting unusual data to make informed decisions.
You might also like - Top 6 Data Insights You Can Gain from Appointment Scheduling Software
Mistake #3: Measuring Activity Instead of Outcomes
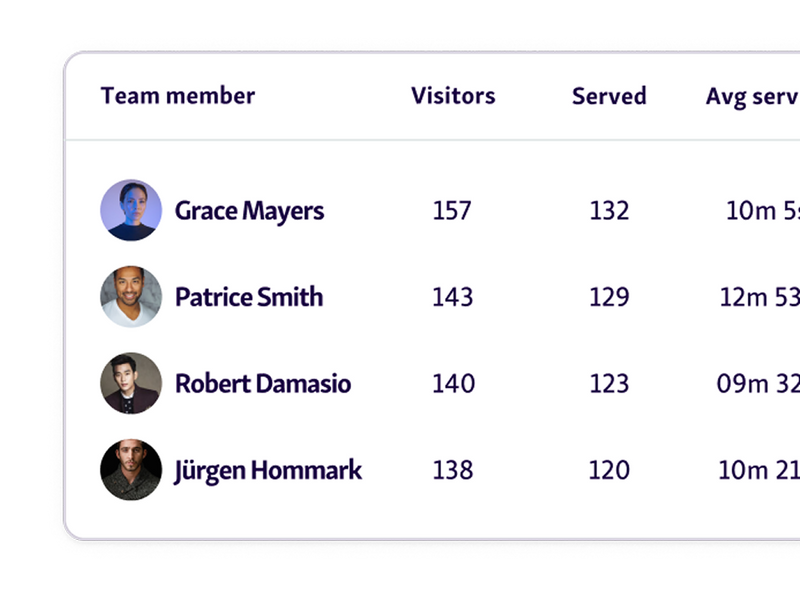
In the public sector, it's common to track operational metrics like the "number of visitors served" or "number of tasks completed" as indicators of success. However, these activity-based metrics often don’t reflect the actual quality of service.
Just because you’ve processed a high volume of citizens doesn’t mean you’ve met their needs effectively or resolved their issues. In fact, focusing only on activity can overshadow the true goal: improving citizen experience and achieving successful resolutions.
Service quality metrics, such as customer satisfaction, resolution times, and the effectiveness of interactions, provide more accurate insights into the performance of public sector services.
How to Avoid It:
Focus on Outcomes: Link data to tangible outcomes like resolution success, citizen satisfaction, and issue resolution times.
Track Service Quality Metrics: Use analytics to track customer feedback and satisfaction scores, rather than just volume metrics.
Balance Activity and Quality: Understand that high activity can sometimes mask underlying problems. Aim to balance both quantity and quality of service.
Use KPIs for Improvement: Develop key performance indicators (KPIs) that focus on service quality, such as wait time satisfaction and first-contact resolution, to ensure more meaningful metrics.
Mistake #4: Treating All Services as Equal
In the public sector, not all services are created equal. Each service has its own set of complexities, time requirements, and staffing needs. For example, processing a simple driver’s license renewal is far less time-consuming than conducting an in-depth health assessment or a legal consultation.
When all services are treated the same way, it leads to skewed performance metrics. Comparing such different services under the same performance umbrella can result in inaccurate conclusions about resource allocation, wait times, and staff performance.
How to Avoid It:
Categorize services by complexity and staffing needs: Break down services into categories to see where time or resource disparities lie.
Track service performance separately: Analyze each service’s metrics to avoid generalizations that mask inefficiencies.
Focus on service-specific metrics: Use distinct KPIs for different services, such as average wait time or complexity of requests, to get a more accurate picture.
Adjust staffing levels based on service type: Ensure that staffing and resources are aligned with the unique needs of each service.
Mistake #5: Overlooking Staff Impact and Capacity
When interpreting public sector service data, it's easy to focus solely on the numbers, such as wait times, number of visitors, or service completion rates. However, these metrics are incomplete without considering the staffing context.
Burnout, understaffing, or skill gaps can significantly skew the results, creating unfair conclusions about team performance. For example, a sudden increase in wait times might be due to a key staff member being absent or struggling with workload, not because the system itself is inefficient.
How to Avoid It:
Include staffing data in analysis: Always correlate performance metrics with staff availability and workload to understand the full picture.
Track employee well-being: Monitor staff capacity, burnout, and skill gaps to ensure the right resources are in place.
Use data to support staff development: Rather than just evaluating performance, use data to identify areas where staff need more support or training.
Factor in absenteeism and turnover rates: Take into account the impact of employee absences or high turnover when analyzing service performance.
Mistake #6: Failing to Track Trends Over Time
Relying on single-day or single-week snapshots can be misleading when analyzing public sector service data. Short-term data points often fail to capture the true fluctuations in service demand, leading to impulsive decisions based on temporary spikes or dips.
For instance, a sudden increase in wait times on a given day may not reflect a systemic issue but could be a one-off event, such as a holiday or a local event. Without a long-term view, it's easy to overlook the bigger picture, which might include seasonal variations or longer-term shifts in citizen behavior.
How to Avoid It:
Track historical data: Regularly analyze data over weeks, months, or even years to identify long-term trends.
Look for patterns: Spot recurring patterns in service demand to better prepare for peak periods or shifts in citizen behavior.
Make data-driven predictions: Use historical trends to forecast demand and plan resource allocation accordingly.
Avoid knee-jerk reactions: Ensure that decisions are based on sustained data trends rather than isolated spikes or drops.
Also read - Top 5 Performance Metrics Every Retail Service Dashboard Should Track
Mistake #7: Not Acting on the Data Collected
Collecting data is only half the battle. Public sector agencies often struggle to turn the insights gathered from data into actionable steps.
Many organizations have robust dashboards and detailed reports, but without a plan for using that information, it remains dormant. It's easy to assume that data alone will automatically lead to improvements, but this isn’t the case.
The key lies in using the insights to make informed decisions and implement operational changes that directly impact service delivery.
How to Avoid It:
Set clear action plans: Ensure that every piece of data collected is tied to a specific action or decision.
Turn insights into operational changes: Use analytics to improve processes, reallocate resources, or address bottlenecks.
Integrate with workflows: Make sure that data findings are integrated into daily operations for continuous improvement.
Monitor results: Track the outcomes of data-driven decisions to ensure measurable improvements and adjust as needed.
Turning Data into Actionable Insights for Better Public Service
Avoiding these common mistakes can significantly enhance how public sector agencies use data to improve service delivery. By focusing on the right metrics, understanding context, and using data to make informed decisions, you can drive meaningful improvements.
The key is not just collecting data but turning it into action that leads to better outcomes for citizens and staff alike.
Qminder helps public sector agencies streamline data collection, provide real-time insights, and take actionable steps to improve service.
Start using Qminder today to turn your service data into a competitive advantage.
Tracking trends over time allows public sector agencies to identify recurring patterns, anticipate demand fluctuations, and plan for resource allocation effectively. Without historical data, decisions can be reactive rather than proactive, potentially leading to inefficient service delivery.
By analyzing service data alongside staff performance metrics, agencies can identify training needs, optimize workflows, and reduce burnout. This helps in providing support where it's most needed, improving both staff morale and service quality.
Yes, service analytics tools provide valuable insights into long-term trends, helping agencies plan for future growth, infrastructure needs, and staffing requirements. These insights make it easier to allocate resources wisely and implement policies that improve service efficiency.
Get to know our solutions
We will give you a short but great overview of how Qminder can improve your business and visitors experience.
Try out Qminder for yourself and see how we can improve your business and visitors experience.