As important as customer service is, can you measure it? Is there a way to analyze your service efforts? Actually, there is — and it’s service intelligence.
Service intelligence helps you better understand the way you serve your customers.
In this article, we’ll be covering what service intelligence means and what makes it such an integral part of business success.
What is service intelligence?
Service intelligence collects and analyzes data to help make better customer service decisions.
Service intelligence is essentially a customer-focused extension of Business intelligence. It provides a clear, data-driven overview of your operations, supported by measurable insights.
The underlying understanding of service intelligence is that service begins even before a customer is served or even joins a queue.
From the way you approach greeting to the visual outlook of your queuing situation, to the smoothness of sign-in — everything contributes to giving your customers lasting positive impressions of your location.
What are the key performance indicators in service intelligence?
Two of the more important KPIs you gain from service intelligence are wait times and service times. The names are self-explanatory, but let’s go over them just in case.
Wait time is the amount of time a customer spends between the arrival and the beginning of service. Wait times that are too long are a clear sign that something is wrong with the queue management strategy.
Service time is the amount of time a customer spends being serviced. Long service times may be less damaging than long wait times, but it’s a safe bet that no one likes to waste their time.
Despite these times being clearly divided into two separate categories, there’s no use in thinking they’re that much different. In fact, waiting is part and parcel of service.
While many customers think queuing is an often unpleasant prelude to the actual servicing part, it’s best to think of it as a “pre-service service”. If one plays their cards right, a proper waiting experience can already feel like a part of the service.
Service Intelligence gathers individual as well as collective wait times and service times. This makes it an ideal tool for assessing situations on different levels.
How to optimize service with service intelligence?
Service intelligence gives you access to visitor history, where you can learn all the important information about the service your customers have received. Namely, where and when they were serviced, how long they had to wait, and who serviced them.
Also, you get access to whatever information customers entered upon sign-in. As a location manager, you can modify or add any input fields you like: from reason of visit and gender to phone number and payment method.
Wait time and service time are calculated automatically, giving you relevant insights into the efficiency of your service.
Say, you noticed a certain line is lagging behind in terms of service time, or there is an increased foot traffic on certain days. That’s a perfect excuse to introduce some small changes to your service strategy that’s long since gone stale.
With real-time data, you get an immediate insight into whether these changes are a step in the right direction. Basically this:
Make a change.
Collect feedback.
Go to step 1.
What are the advantages of service intelligence?
Just like Business intelligence, service intelligence offers its fair share of advantages. At the very least, data collection leads to fact-based decisions when identifying opportunities, and helps gain a better understanding of your service.
But instead of vaguely pointing out how it “removes guesswork” or “incentivizes changes”, let’s review in depth the most important benefits of service intelligence.
1. Empower front-line employees
Front-line employees are the cornerstone of your customer service—they’re the first people customers interact with and, in many ways, represent your entire business. From the customer’s perspective, these team members are the face of your brand.
So how does service intelligence come into play here?
First of all, it helps you manage the workflow. It gives you enough information to make meaningful changes when it comes to workforce allocation and task distribution.
Service intelligence allows you to identify trends in customer demand by continuously tracking service data — such as peak hours, average wait and service times, visitor traffic patterns, and staff performance.
You can pinpoint exactly when and where service volume spikes, which days require more coverage, or which locations experience bottlenecks. This insight lets you make informed staffing decisions, ensuring the right number of employees are available at the right time.
For example, if your data shows a consistent rush between 11 AM and 1 PM every Monday, you can proactively schedule more staff during that window instead of reacting to long lines and overwhelmed employees.
Similarly, if certain services take significantly longer than others, you can adjust assignments or provide targeted training to optimize efficiency.
This reduces stress and helps your employees focus on delivering high-quality service when and where it’s needed most, and not just reacting to pressure.
Read also - Happy Employees Make Happy Customers
2. Provide personalized service
Service intelligence allows you to serve customers based on their preferences and service history.
The first thing a Qminder check-in kiosk asks from a customer is their name. This allows your employees to call your customers by name, making for a more personal touch.

Let’s say you provide a wide range of services. Thanks to data you get upon customer’s registration, you can better match them with a respective service agent no matter which service they’re looking for.
Instead of treating every visitor the same or calling them to the counter by a ticket number, service intelligence gives your team the context they need to provide a more thoughtful, personalized customer experience—one that leaves a lasting impression.
This not only shortens the time spent in queues, but also makes customers feel seen and valued.
3. Monitor employee performance fairly
Service intelligence helps you track employee performance.
You get an overview of how well each employee is providing services. By analyzing their average wait and service times, you can decide if you need to reward their performance or whether additional training is in order.
Performance is more than just numbers, though. When you see employee performance hit low, you need to act upon the collected information to identify pain points and eliminate the obstacles.
Moreover, service Intelligence promotes fairness and transparency. With data on service durations, visitor loads, and performance metrics, task distribution can be more balanced—no more one team member quietly handling the bulk of work while others remain underutilized.
Everyone gets visibility into their contributions and performance, making recognition more objective and development opportunities more targeted.
4. Know your location better
For businesses with many different branches and locations, however, knowing how well each of them are doing individually is extra vital.
What customers are looking for nowadays is uniformity of experience. If they enjoyed service at one of your locations, they expect the same no matter which other location of yours they visit next.
In short, a franchise is expected to provide the same level of customer care across all locations. Easier said than done, however, especially when there are no clear numbers to compare.
Meanwhile, the live reporting feature of service intelligence lets you keep track of seasonal and geographical changes. On a larger scale, the data you gather with service intelligence leads you to making informed, strategic business decisions.
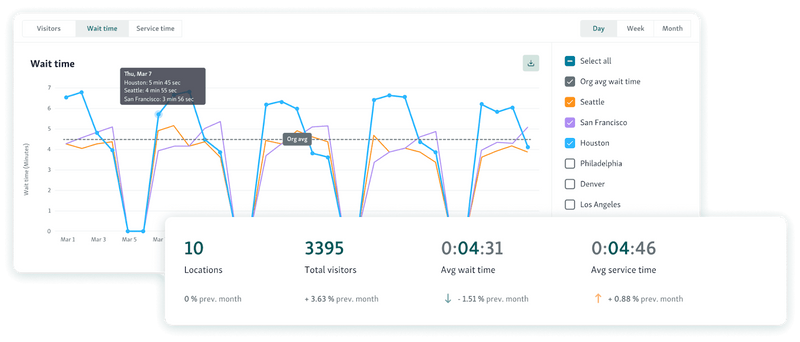
There's no use in providing good customer service if it's not consistent across all of your locations. Customer service is part of your brand. And with service intelligence, you have the tools to make it part of your entire franchise.
5. Make strategic business decisions
When you’re trying to shoot for premium customer service, you can’t go by your gut feeling alone — you need to back your decisions with data.
The more precise the metrics, the more you can do to optimize your location. It’s not just about employee performance — you get access to service metrics, visitor insights, and history log.
The level of queuing experience is a major deciding factor for your location’s success. And you can’t improve this experience without knowing for sure all the relevant numbers.
How many people on average are there in your queues? What’s the wait time? What’s the service time? These are the questions you need to answer if you want to not only get visitors but also persuade them to stick with you.
Then, there’s a matter of acting on this information.
With service notifications, you can actually react to live changes in your location. For example, if wait times get too long or there’s a sudden rush hour, you get notified and can act accordingly.
Actionable data also comes in the form of service reports giving you a quick summary of location performance. These reports are delivered straight to your inbox, and you can use them in weekly meetings or when budget planning.
What can you get out of the service intelligence statistics in Qminder?
Now that we’ve addressed the main benefits of service intelligence for your business, let’s see it in action. Or, to be exact, in the Qminder dashboard. There are a lot of things to cover, so sit down and get comfortable.
1. Visitor History
Visitors are the lifeblood of your business. Without them, you don’t have a purpose, so it pays to learn a thing or two about them.
This is where visitor history comes into play, which you can found by accessing your Qminder dashboard and going to the History tab.
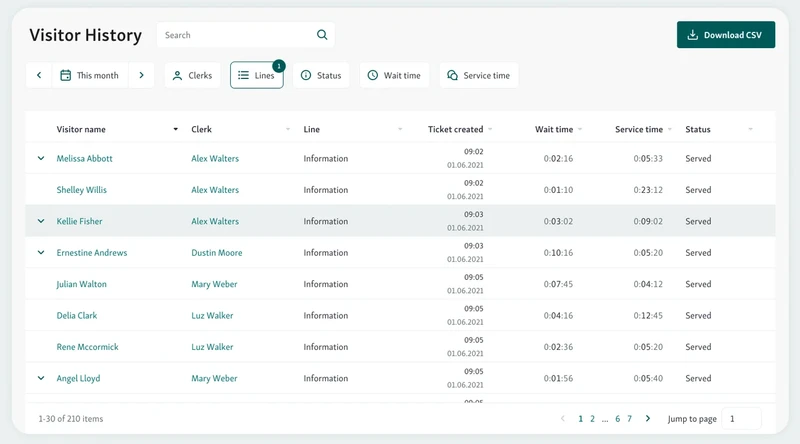
This screen is already self-explanatory, but let’s go over a few things. First of all, you see a list of all visitors that signed up for your services, with their name clearly designated in the left column.
This visitor history can be filtered by:
Status — see whether they’ve been served, currently waiting, decided not to show up, etc.
Period — select a period of time, from a specific date or date range.
Clerk — shows served visitors for any or all available clerks.
It calculates wait time and service time, with precise dates for both, and collects all relevant visitor information that was entered upon their sign-in. This information may be as basic their first and last names as well as contact information, or as in-depth as you want it to be.
Take advantage of custom input fields during visitor registration to capture the essential information about their visit and the service they want to be catered to them.
2. Employee Performance
The other side of customer service is, of course, your employees. Making sure your staff has all the tools and information they need to provide good service helps you keeping a finger on the pulse of your business.
The Qminder dashboard gives you an insight into how well your clerks are doing. To see how many visitors each clerk has served over a selected period, go to Statistics > Clerks.
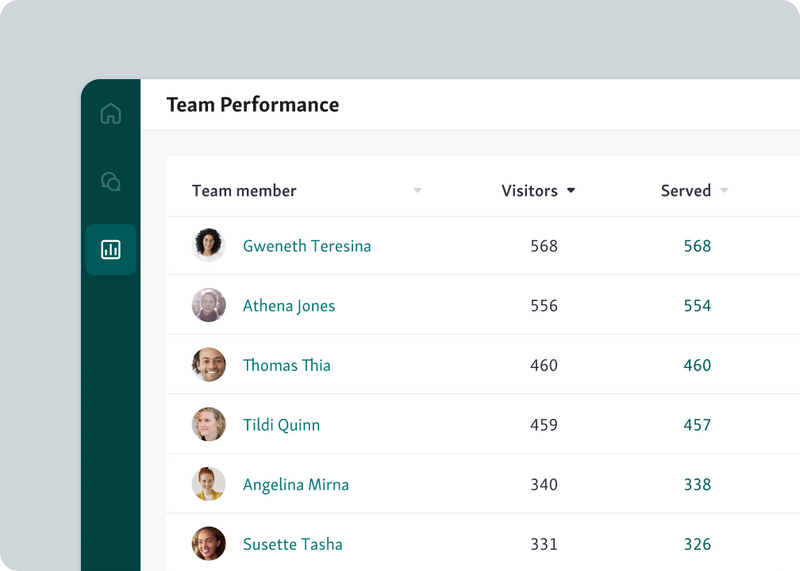
Choose a specific line and select a period of time to see how well each individual employee is doing. Their performance is divided into three categories:
Visitors Served — a total number of visitors served by this employee.
Average Service Time — time spent on servicing each visitor, i.e. total service time divided by a number of served visitors.
Total Service Time — time spent on servicing all visitors.
Employee-specific statistics helps you gauge performance of each individual worker and draw correct conclusions when deciding on the staff dynamic and planning.
Do you need more lines? Is it necessary to deploy more front-line workforce? These are the questions you can now answer with confidence.
3. Location performance
Let’s pull the camera back a bit. Measuring the performance of your staff is truly an important part of business success, but it’s just one aspect of the overall location performance.
Our name might have already given it away, but Qminder really cares about making queuing as good as possible. When it comes to waiting experience, there are three key components you need to pay attention to:
Queue Length.
Waiting Times.
Service Times.

Queue Length shows you the average amount of visitors waiting in line. Waiting Times designate how long a visitor needs to wait before being called. Lastly, Serving Times are the length of servicing a single visitor.
Location performance — which you can access by going to Statistics > Performance gives you a quick, basic rundown on what the average queuing experience at your location looks like.
Not every business-changing decision can be made on the basis of these simple stats, though. That’s why you need to look into daily visitors statistics, which you can access through Statistics > Visitors.
There are several charts, which give you a more detailed visual breakdown of the daily queuing experience in your location.
The first such chart is Daily Visitors, which is an overview of visitors. This overview is given for the selected period, which can be changed by clicking the top-left corner. You can also see daily visitors either for all lines or each one separately — click the top-right corner.

NB: The total number of visitors is calculated on the basis of this formula:
Served Visitors + No Shows + Cancellations = Total Visitors
Below, you can see a table with a detailed breakdown of daily visitors for every line.
The next two charts look quite similar and fulfill the same purpose — to give you period-specific information about your visitors.
Firstly, there’s Average Hourly Visits, where the X-axis represents hours — with “am”/“pm” designation for context — and the Y-axis represents the number of visitors.
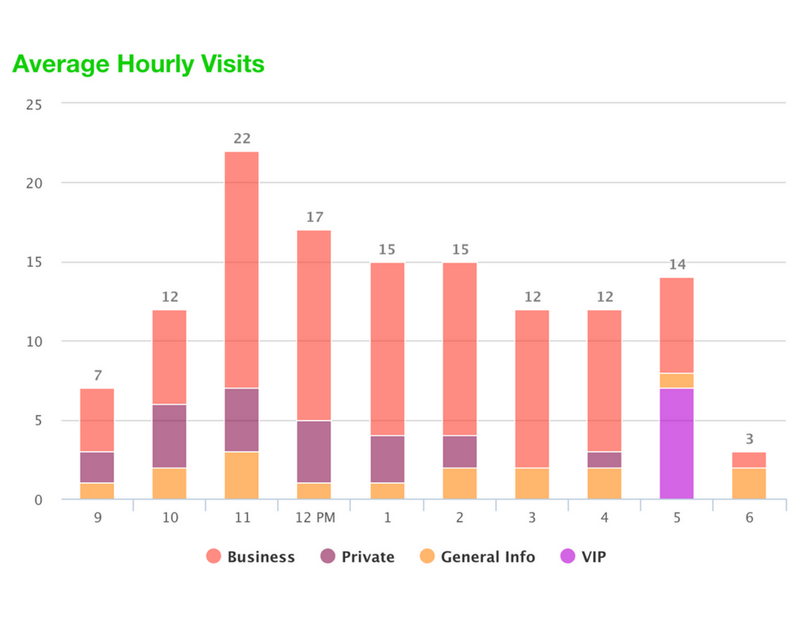
The next chart is Visits by Day of Week, which should be self-explanatory. It is the same as the Average Hourly Visits chart, only now X-axis shows the abbreviation of the respective day of the week (Mon, Tue, Wed, etc.).

Lastly, Channels is a chart that breaks down the way your visitors are signed in. This can be either manually by a clerk or via an iPad self-sign-in application.

4. Service intelligence reports
The Qminder dashboard gives you all the numbers you need, but you don’t need access to it to have these numbers on your hand.
You can access your location’s statistics outside of the Qminder system, by exporting the data as an Excel spreadsheet. To export a spreadsheet, go to the History tab and hit Export in the top-right corner.
Once the report is downloaded, you’ll notice it has three separate sheets titled Visitors, Clerks, and Lines.
The Visitors sheet contains all the necessary information about the way visitors are served: the name of a clerk who served them, precise times of call and service end as well as wait time and service time.

The Clerks sheets breaks down the ticket allocation among clerks, where rows show a number of tickets served and columns show individual dates. A column with the names of all clerks is frozen in place for your convenience, so that when you scroll to the right, you can still see which clerk every number corresponds to.

NB: Cancelled tickets are not accounted for. In case there are no actual tickets, this sheet will not be generated.
The Lines sheet looks similar to the Clerks sheet, only instead of clerks, it shows the names of your lines. A column with all the lines is frozen in place as well.

Service Intelligence reports are an invaluable tool for backing your decisions with hard numbers. The Excel spreadsheet is a perfect tool to back your marketing or budgeting plans during a monthly meeting.
Turn insight into action with Qminder service intelligence
Hope this was informative! If you’re going to take a lesson out of this article, let it be this — don’t be afraid to experiment with the data.
See what works and what doesn’t for your state of business. Perhaps you’ll get more use out of employee performance stats than visitor history, or vice versa.
Our point is, you don’t have to be in the dark when it comes to the quality of your customer service. The entire aim of Service Intelligence is to be your guiding tool.
Feeling inspired and want to give it a go?


![10+ Best Waitlist App and Software [Updated 2025]](/static/img/cms-blog/6wb7I1FIB5vRxQ1JsrOAiE/best-waiting-line-management-software.jpg)


