

Public expectations of government services have changed. Citizens now compare their experience with public sector agencies to the speed and transparency they get from private organizations.
When long waits, unclear processes, or repeated visits become the norm, trust erodes fast. This is where service analytics plays a critical role.
Modern customer service analytics helps public sector agencies understand how services are actually delivered, not how they were designed on paper. By tracking wait times, service demand, staff workload, and visitor behavior, agencies can spot bottlenecks, justify resourcing decisions, and improve outcomes without increasing headcount.
This guide breaks down the best service analytics platforms built specifically for public sector agencies that need clarity, accountability, and measurable improvement in citizen-facing services.
Quick Comparison Table - TL;DR
This table compares leading service analytics and customer service analytics platforms based on analytics depth, review ratings, and pricing transparency for public sector agencies.
Platform | Analytics Strength | G2 Rating | Starting Price |
Real-time wait times, staff & location performance, service intelligence | 4.6 | $389/month | |
Skiplino | Predictive analytics, historical KPIs, demand forecasting | 4.5 | $300/month |
Square Appointments | Booking utilization, staff usage, no-shows | 4.5 | $29/month/location |
Qmatic | Enterprise BI, deep reporting, journey analytics | 3.8 | On request |
Wavetec | BI-driven analytics, ROI & KPI tracking | 4.8 | On request |
QLess | AI-driven demand forecasting, live operational insights | 4.3 | On request |
Nemo-Q | Real-time dashboards, throughput & staff analytics | N/A | $290/month |
Vizitor | Visitor flow tracking, basic service analytics | 4.1 | $36/month |
Qwaiting | Department, staff & branch performance reports | 4.7 | On request |
NextMe | Lightweight wait time & peak hour analytics | 5.0 | Free / $49.99/month |
Top 10 Service Analytics Platforms
The platforms below focus on service analytics and customer service analytics that help public sector agencies measure performance, reduce wait times, and improve service delivery using real operational data, not assumptions.
1. Qminder

Qminder is a queue management and service analytics platform built to help public sector agencies turn in-person visits into clear, actionable data. Instead of guessing what’s happening on the front line, teams get real-time visibility into wait times, visitor demand, staff performance, and service bottlenecks across locations.
It captures data at check-in, tracks the full service journey, and turns that information into insights managers can act on immediately. Agencies use it to reduce walkouts, improve staffing decisions, and deliver more consistent service without adding complexity for visitors or staff.
Key Features:
Real-time tracking of wait times, service times, and visitor flow
Visitor history and visit reason tracking for better routing and personalization
Location, team, and individual performance comparisons
Live dashboards for managers to spot bottlenecks as they form
Analytics on peak hours, no-shows, and demand patterns
Service intelligence reports to support staffing and policy decisions
API integrations with scheduling, CRM, and internal systems
Why it works for public sector agencies:
Designed for high-volume, in-person services
Fast to deploy and easy for staff to adopt
Strong compliance coverage for regulated environments
G2 Rating: 4.6
Pricing: Free 14-day trial. Paid plans start at $389/month.
2. Skiplino

Skiplino is a service analytics-driven queue management platform built for high-traffic public sector agencies that need tighter control over visitor flow and operational performance. It combines remote check-ins with built-in analytics to help teams understand demand patterns, reduce congestion, and improve service efficiency across counters and locations.
Beyond basic queue handling, Skiplino’s analytics layer (Skiplytics) turns historical and real-time queue data into visual dashboards and performance insights. This helps managers forecast peak hours, allocate staff more accurately, and identify service bottlenecks before they escalate.
Key Features:
Remote queue entry via mobile app or web link
Real-time SMS and app notifications tied to live queue data
Analytics dashboards with historical and real-time KPIs
Performance tracking across services, time periods, and locations
Predictive insights to forecast demand and optimize staffing
CRM and management system integrations
Why it works for public sector agencies:
Strong focus on operational analytics, not just queue visibility
Useful for multi-service, high-volume service centers
Helps leaders move from reactive to data-driven decisions
G2 Rating: 4.5
Pricing: Plans start at $300/month
3. Square Appointments

Square Appointments is an online scheduling platform that combines appointment booking, payments, and basic service analytics in one system. From a service analytics perspective, Square focuses on appointment performance rather than in-person queue flow. Agencies can track schedule utilization, no-shows, repeat visits, and staff performance through built-in reports.
While it’s not designed for managing physical queues or walk-ins at scale, it works well for departments that operate primarily on booked appointments and need clear visibility into booking trends and revenue.
Key Features:
Online and in-person appointment booking in one system
Built-in POS for secure payment processing at time of service
Appointment performance reports for retention, pre-booking, and utilization
Staff and resource management tied to booking data
Mobile-optimized booking experience for website visitors
Google Calendar integration for scheduling visibility
Why it works for public sector agencies:
Useful for appointment-driven services with payment requirements
Clear reporting on staff usage and booking efficiency
Easy for citizens to book and pay in one step
G2 Rating: 4.5
Pricing: Free for one location; paid plans start at $29/month per location
4. Qmatic

Qmatic is an enterprise-grade service analytics and queue management platform built for high-complexity environments like healthcare systems and public sector agencies. It captures data across the entire visitor journey and turns it into real-time dashboards, historical reports, and BI-ready datasets.
Agencies can monitor wait times as they happen, analyze no-shows, compare branch performance, and understand how staffing, scheduling, and demand patterns affect service outcomes.
Key Features:
Real-time dashboards tracking wait times, service times, no-shows, and volume
Advanced reporting with exports in PDF, CSV, and XLSX formats
Appointment vs walk-in analysis to assess booking accuracy and service load
Staff and branch performance comparisons across key KPIs
Waiting-time and transaction-time distribution analysis, not just averages
BI integrations via Data Connect API for deeper analysis in external tools
Customer feedback and NPS insights tied directly to wait-time data
Why it works for public sector agencies:
Strong fit for large, multi-location service operations
Detailed analytics support staffing, budgeting, and service-level planning
Real-time visibility helps managers respond to bottlenecks immediately
G2 Rating: 3.8
Pricing: Price available on request
5. Wavetec

Wavetec is a full-scale service analytics and queue management platform built for large, high-traffic environments, including hospitals and public sector agencies. Wavetec’s strength lies in Spectra, its enterprise reporting and BI layer.
Spectra captures data across channels and touchpoints, then turns it into real-time dashboards, historical reports, and predictive insights. Public sector agencies can analyze wait times, walkouts, staff productivity, service quality levels, and branch performance while also tying feedback and experience data back to operational metrics. This makes Wavetec especially useful for agencies that need to justify budgets, improve service KPIs, and measure ROI at scale.
Key Features:
Spectra analytics platform with real-time dashboards and KPI tracking
50+ historical reports covering service quality, staff performance, and branch trends
Drill-down reporting to analyze wait times, walkouts, and service bottlenecks
AI- and BI-driven insights to predict demand and optimize staff allocation
Integrated customer feedback analytics linked to service performance
Centralized configuration and reporting across multiple locations
Multilingual reporting and dashboards for diverse service environments
Why it works for public sector agencies:
Built for high-volume, multi-location service operations
Strong analytics support cost reduction, staffing optimization, and KPI reporting
Combines operational data and customer experience data in one platform
Pricing: Price available on request
6. QLess
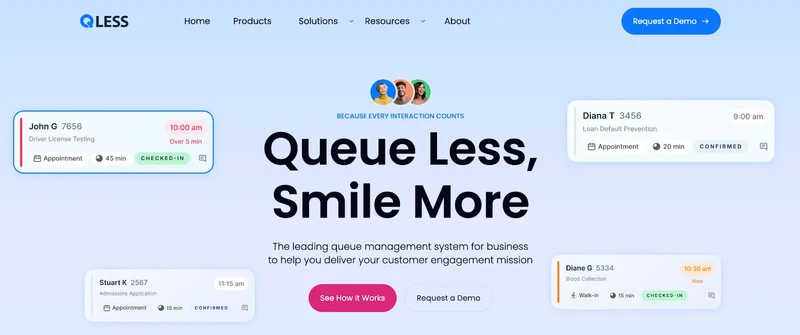
QLess is a service analytics and queue management platform widely used by DMVs, government offices, healthcare systems, and higher education institutions across the U.S. The platform combines queue data, appointment activity, and staff performance into live dashboards that help leaders identify bottlenecks, track demand patterns, and improve service outcomes without adding headcount.
Its analytics layer makes it easier to understand where wait times spike, which services cause delays, and how staffing decisions impact citizen experience.
Key Features:
Real-time dashboards showing wait times, queue volume, and service performance
AI-powered analytics to forecast demand and balance workloads across locations
Operational insights to identify inefficiencies and long-running interactions
Employee performance analytics tied to service speed and satisfaction
Customer insights to track friction points and service leakage
Live alerts that surface bottlenecks as they happen
Reporting across locations, services, days, and peak hours
Why it works for public sector agencies:
Proven in high-volume environments like DMVs and permit centers
Strong focus on operational and staff-level analytics, not just queues
Helps agencies reduce wait times without increasing costs
G2 Rating: 4.3
Pricing: Price available on request
You might also like - Top 10 Qless Alternatives for a Queue Management System
7. Nemo-Q
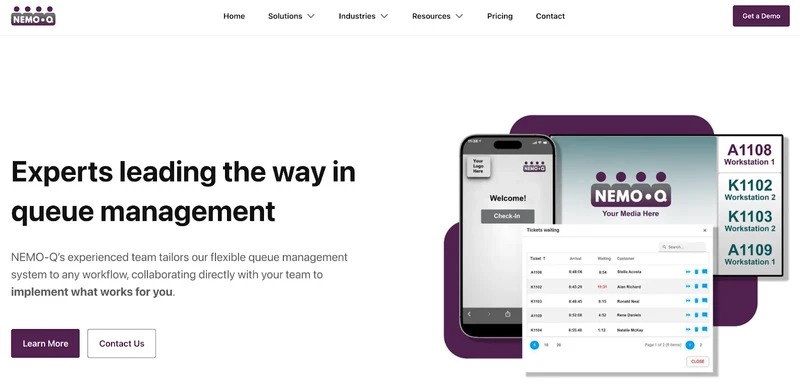
Nemo-Q is a queue and service analytics platform used by hospitals, government offices, and other high-traffic public sector agencies that need clear visibility into how services are delivered. For public sector agencies, Nemo-Q provides detailed customer service analytics across wait times, throughput, staff productivity, and service demand.
Agencies can monitor live dashboards, review historical trends, and generate custom reports to understand where delays occur and how operational changes impact service delivery. This makes it easier to balance efficiency with citizen experience, especially across multiple locations or departments.
Key Features:
Real-time dashboards tracking wait times, queue volume, and service throughput
Detailed performance metrics for staff and individual services
Historical reporting to analyze trends by day, week, or location
Custom reports and exportable analytics for operational reviews
Automated alerts when wait time thresholds are exceeded
Appointment data blended with walk-in queue analytics
Built-in customer feedback tied to service performance
Why it works for public sector agencies:
Strong analytics layer designed for operational decision-making
Supports multi-location reporting from a single dashboard
Helps reduce wait times while improving staff utilization
G2 Rating: N/A
Pricing: Starts at $290/month
8. Vizitor

Vizitor is a digital check-in and service analytics platform that helps public sector agencies replace manual logs with real-time visibility into visitor flow. For public sector agencies, Vizitor works well in offices where controlling front-desk congestion and tracking visitor movement matters more than complex workflow automation.
Its centralized dashboard gives staff a live view of who is checked in, how long they’ve been waiting, and where bottlenecks may be forming. Historical logs and exports make it easier to review service patterns, audit activity, and improve day-to-day operations without heavy infrastructure.
Key Features:
Centralized dashboard with real-time queue and visitor activity
Live visibility into checked-in visitors and wait durations
Historical visitor logs with monthly and daily trends
CSV exports for reporting and internal reviews
Smart token assignment across multiple departments
Automated alerts for overstays or missed check-outs
Cloud-based access for managing multiple locations
Why it works for public sector agencies:
Simple analytics layer for monitoring front-desk performance
Easy to deploy without complex hardware or training
Useful for offices handling high daily visitor volume
G2 Rating: 4.1
Pricing: Starts at $36/month
9. Qwaiting

Qwaiting is a cloud-based service analytics and queue management platform used widely by public sector agencies, healthcare providers, and high-traffic service offices. For agencies handling large daily volumes, Qwaiting replaces paper tokens with real-time dashboards and structured reporting.
Managers can monitor queue health live, analyze monthly and department-level trends, and compare branch performance to identify delays, staffing gaps, or service bottlenecks. Its built-in analytics make it easier to move from reactive fixes to data-driven service planning.
Key Features:
Real-time dashboard showing current wait times, served visitors, and active queues
Department and category reports to analyze service demand and peak hours
Staff performance reports with service time, workload, and activity tracking
Branch-level analytics for comparing multi-location performance
Monthly and historical reports to spot long-term trends
Exportable reports (PDF, CSV, Excel) for audits and reviews
Multilingual displays and cloud-based access for distributed teams
Why it works for public sector agencies:
Strong reporting depth without complex BI setup
Clear visibility into staff efficiency and citizen wait times
Scales well across multiple branches and departments
G2 Rating: 4.7
Pricing: Price available on request
10. NextMe
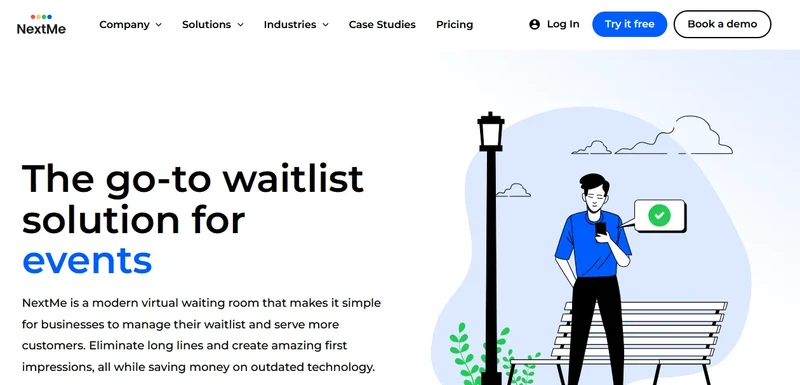
NextMe is a lightweight service analytics and waitlist platform built for small offices, clinics, and front desks that mainly handle walk-in traffic. Visitors join the queue from their own phone and track progress through a virtual waiting room.
On the analytics side, NextMe captures key data points like peak hours, average wait times, and repeat visits. This gives small public sector agencies and local service desks enough insight to spot patterns, reduce congestion, and improve daily operations without needing a full BI stack.
Key Features:
Mobile-based, touchless check-in with virtual waiting room
Live queue status and automated SMS call-forward notifications
Analytics dashboard showing wait times, peak periods, and visit volume
Simple daily and weekly performance reports
Data export in CSV or Excel for external analysis
Privacy controls to anonymize visitor data
POS and loyalty integrations for extended reporting
Why it works for public sector agencies:
Low setup effort with no kiosks or heavy hardware
Clear, easy-to-read service analytics for small teams
Suitable for single-location offices with moderate foot traffic
G2 Rating: 5
Pricing: Free plan includes 100 SMS messages per month. Paid plans start at $49.99/month.
Also Read - 32 Best Virtual Queue Systems – Free & Paid
Turn Service Data Into Better Public Experiences
Choosing the right service analytics platform isn’t about dashboards alone. It’s about understanding where delays happen, why citizens wait, and how staff time is actually spent.
For public sector agencies, strong customer service analytics help uncover bottlenecks, reduce repeat visits, and improve trust through more predictable service delivery. The best platforms turn real-time data into decisions teams can act on immediately, not reports that sit unread.
If you want service analytics built specifically for high-volume, in-person environments, Qminder gives public sector agencies clear insights, live visibility, and measurable improvements from day one.
Explore Qminder and see how smarter service data can transform your front-line operations.
Most public sector agencies start seeing actionable insights within the first few weeks. Once data is flowing, trends around demand patterns, service delays, and staffing gaps become visible quickly.
Yes. Historical service analytics data can help agencies justify budget requests, redesign service models, and plan long-term capacity based on real usage rather than assumptions.
Many platforms are designed to support multi-department and multi-location environments, allowing leadership teams to compare performance, identify inconsistencies, and standardize service delivery across offices.
Get to know our solutions
We will give you a short but great overview of how Qminder can improve your business and visitors experience.
Try out Qminder for yourself and see how we can improve your business and visitors experience.