
When teams work across a multi department environment, even small gaps in visibility can slow everything down. Requests bounce between desks, queues pile up, and staff end up reacting instead of planning.
That’s where dashboard important features start to matter more than most teams realize. The right features of dashboard don’t just show numbers. They connect people, priorities, and timing in one place.
A well-designed queue management dashboard or queue management system dashboard can quietly transform how departments coordinate, hand off work, and stay aligned throughout the day. Instead of silos, teams get shared context. Instead of guesswork, they get clarity.
In this blog, we’ll look at lesser-known dashboard important features and how they improve multi department workflows, queue visibility, and day-to-day execution across teams.
What Modern Operational Dashboards Really Do
Modern operational dashboards are no longer passive reporting tools. In a multi department setup, they act as the shared system teams rely on to stay coordinated, responsive, and aligned throughout the day.
-
Move beyond static reporting
Instead of looking at yesterday’s numbers, teams see what’s happening right now. This makes the dashboard a living tool, not a historical report.
-
Act as a real-time control center for multiple teams
A queue management dashboard brings activity from different departments into one view, so nothing gets lost between handoffs.
-
Support coordination, prioritization, and faster decisions
The right features of dashboard help staff quickly see what needs attention first and where support is needed.
-
Align leadership and frontline staff around the same data
When everyone works from the same queue management system dashboard, decisions feel clearer and less reactive across the entire multi department workflow.
Dashboard Features That Transform Multi-Department Workflows
The most impactful dashboard important features don’t just display data. They actively connect teams, remove blind spots, and keep multi department operations moving in sync, even when demand spikes or situations change quickly.
1. Real-Time Data Synchronization Across Departments
Real-time data synchronization is one of the most powerful features of dashboard design in a multi department environment. When every team sees the same live information, decisions happen faster and confusion drops immediately.

Instead of departments updating their own spreadsheets or relying on calls and emails, a queue management dashboard keeps everything aligned in one place. The moment something changes, everyone sees it.
Live updates prevent teams from working on outdated information
If a queue grows, a counter closes, or priorities shift, the update appears instantly across the queue management system dashboard.
Reduces back-and-forth communication
Staff don’t need to ask other departments for status updates because the dashboard already shows what’s happening.
Improves response time during peak demand or incidents
When pressure builds, managers can spot issues early and reassign resources before delays spiral across departments.
In practice, this feature turns the dashboard into a shared source of truth, helping multi department teams act together instead of reacting in silos.
2. Role-Based Views and Permissions
Role-based views are one of the most practical dashboard important features for multi department teams. Instead of everyone seeing the same cluttered screen, the queue management dashboard adjusts based on who is logged in and what they’re responsible for.
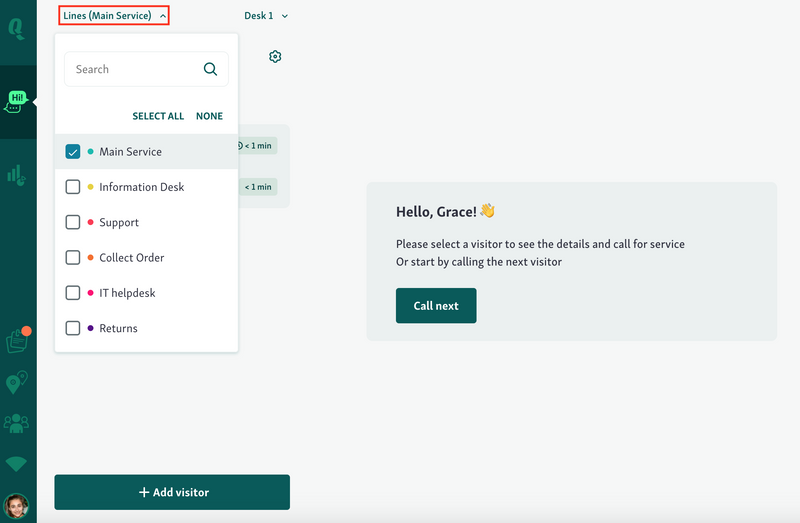
This keeps the focus on action, not noise, while still using a shared queue management system dashboard underneath.
Each department sees what matters to them
Front desks can focus on live queues and check-ins, supervisors see workload balance, and leadership views trends and performance without digging.
Prevents information overload
Staff aren’t distracted by metrics or controls that don’t apply to their role, which leads to faster, more confident decisions.
Maintains data security while improving transparency
Sensitive data stays restricted, while operational visibility remains high across the multi department workflow.
With the right permissions in place, dashboards become usable daily tools instead of overwhelming reporting screens.
3. Cross-Department Performance Metrics
Cross-department performance metrics are some of the most valuable dashboard important features in a multi department environment. Instead of measuring teams in silos, a queue management dashboard shows how work actually moves from one department to the next.
This shifts conversations away from blame and toward fixing the process.
Shared KPIs highlight bottlenecks between teams
Delays in one department show up immediately in downstream queues, wait times, and service handoffs.
Makes interdependencies visible
Teams see how staffing levels, service speed, or backlog in one area affect the rest of the workflow across the queue management system dashboard.
Encourages collaboration instead of finger-pointing
With the same data visible to everyone, departments align on solutions instead of defending their own numbers.
Platforms like Qminder surface these cross-department metrics in real time, helping teams spot friction points early and coordinate fixes before issues escalate.
You might also like - Customer Satisfaction Metrics You Need to Be Tracking
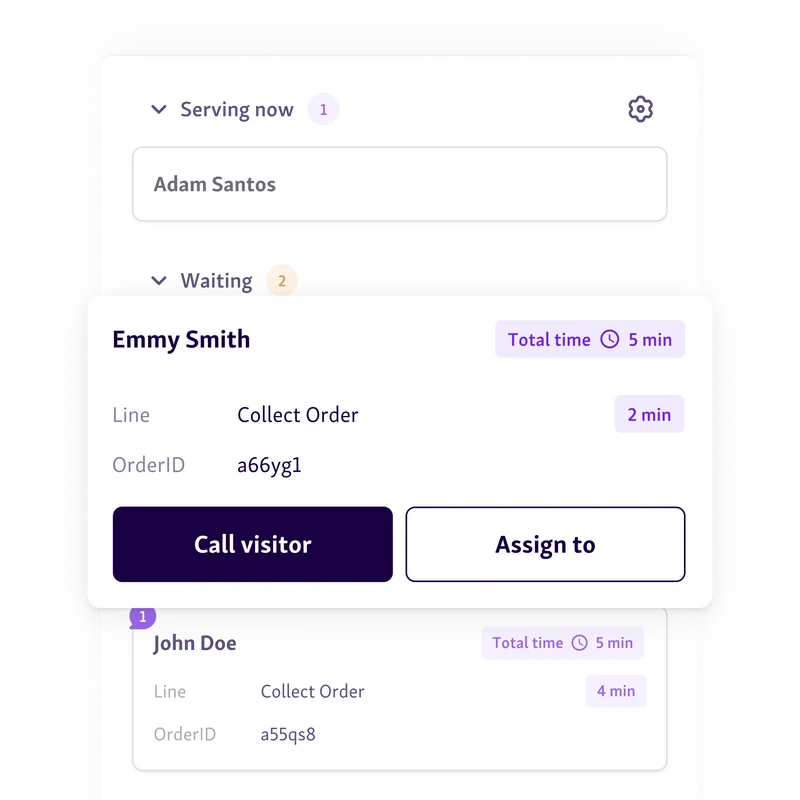
4. Workflow Status Tracking and Handoff Visibility
Workflow status tracking is one of those dashboard important features that quietly fixes a lot of multi department friction. A strong queue management system dashboard makes it obvious where work is moving smoothly and where it’s getting stuck.
Instead of guessing or chasing updates, teams can see progress at a glance.
Clear view of where work is stalled
Each request, case, or visitor shows its current stage, so delays surface immediately instead of hours later.
Reduces missed tasks during department transitions
Handoffs are clearly marked, which prevents items from falling through the cracks when responsibility shifts.
Improves accountability at every stage
Everyone knows who owns the next step, making follow-ups faster and daily operations more reliable across departments.
5. Automated Alerts and Threshold Notifications
Automated SMS alerts and threshold notifications are key features of dashboard systems that enhance the ability of multi-department teams to act quickly. These notifications give teams immediate insights when key metrics fall outside set parameters, enabling them to address potential issues before they escalate.
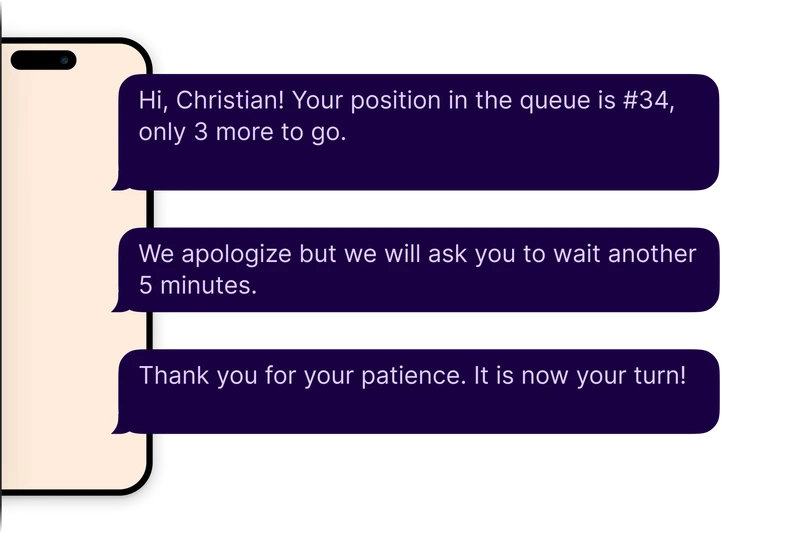
Immediate signals when metrics fall outside targets
Teams are automatically alerted when performance metrics deviate, so no issues go unnoticed.
Helps teams act before small issues escalate
By detecting problems early, teams can address issues quickly, preventing bigger disruptions down the line.
Reduces reliance on manual monitoring
Automation means fewer manual checks and more proactive actions, boosting efficiency and response time.
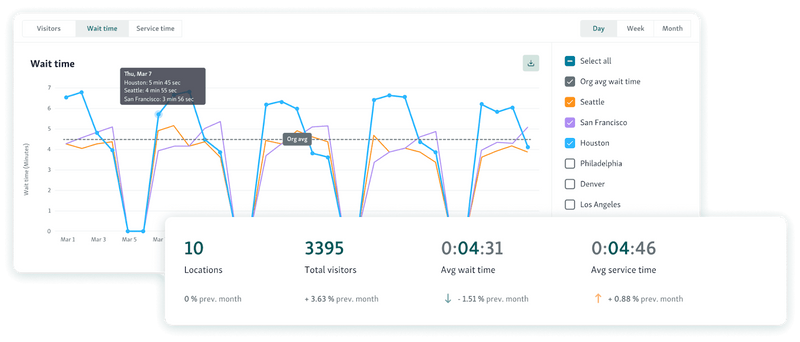
6. Historical Trend Analysis
Historical trend analysis helps teams uncover recurring inefficiencies and operational bottlenecks that may not be apparent in real-time data. By examining past performance, departments can plan for the future more effectively, adjusting processes and resources to improve workflow.
Identifies recurring inefficiencies
Analyzing historical data reveals patterns, making it easier to spot areas that consistently hinder performance.
Supports long-term planning and resource allocation
Understanding past trends allows teams to allocate resources more effectively and plan for future capacity needs.
Helps justify process changes with data
Data-backed insights help leadership justify necessary changes, ensuring that process improvements are supported by measurable evidence.
With tools like Qminder’s service intelligence, teams can gain deeper insights into service trends, helping identify problem areas and implement data-driven solutions that streamline multi-department workflows.
7. Customizable Dashboards Without IT Dependency
Customizable dashboards give teams the flexibility to modify views and metrics without relying on IT support. This feature enhances operational agility by allowing teams to respond quickly to shifting priorities and needs.
Teams can adapt views as needs change
Staff can adjust dashboards to display the most relevant metrics as workflows or priorities shift.
Faster iteration without technical delays
Customization options empower teams to make quick adjustments, ensuring they can adapt without waiting on IT teams.
Encourages ownership and adoption
Giving teams control over their dashboards increases engagement and ensures the dashboard meets their specific requirements.
Helpful read - Top Analytics Tools to Improve Visitor Flow in Government Buildings
Best Practices for Rolling Out Dashboards Across Departments
Implementing a queue management or operational dashboard across multiple departments requires careful planning to ensure successful adoption and effective use. These strategies improve collaboration, transparency, and decision-making across the organization.
-
Start with Shared Goals, Not Tools
When introducing dashboards across departments, focus on aligning all teams around shared objectives rather than just the tools themselves. This ensures that every department is working towards the same outcomes, making it easier to use the dashboards effectively for decision-making.
-
Define Ownership for Metrics
Assign clear ownership for each key metric across departments. This accountability helps teams take responsibility for improving their own performance, leading to better data-driven decisions and ensuring all areas are covered without confusion.
-
Train Teams on Interpretation, Not Just Usage
It’s essential to train staff on interpreting the data, not just using the dashboard. Understanding how to read trends and derive actionable insights from the dashboard leads to more informed decision-making, and helps teams see the bigger picture.
-
Review and Refine Dashboards Regularly
Dashboards should be updated regularly to reflect changing goals and business priorities. Scheduling periodic reviews ensures the dashboards remain relevant, keeping them aligned with evolving workflows and improving overall department efficiency.
Also read - Best Practices for Managing Customer Flow in High-Traffic Government and Public Service Environments
Maximizing Efficiency with Dashboard Features
Effective dashboards can transform multi-department workflows by providing real-time visibility, improving coordination, and enabling faster decision-making.
By focusing on shared goals, clear metric ownership, and regular reviews, dashboards can significantly enhance team performance and productivity. Features like real-time data synchronization, role-based views, and automated alerts are invaluable in streamlining operations.
With a tool like Qminder, which provides comprehensive service intelligence and seamless integration across departments, you can optimize your workflows and stay ahead of potential bottlenecks.
Start using Qminder’s powerful dashboard features today.
Dashboards provide a centralized platform where all departments can view the same data in real time, which reduces miscommunication. This transparency fosters collaboration and ensures that everyone is aligned on priorities and goals.
Key metrics include team performance, workload distribution, wait times, response times, and departmental KPIs. Tracking these metrics allows departments to identify bottlenecks and areas for improvement, ensuring smoother operations across teams.
Yes, dashboards can be tailored to display relevant data for different teams. Customizable views and role-based permissions allow departments to focus on what matters most to them, making it easier to prioritize tasks and improve efficiency.
Get to know our solutions
We will give you a short but great overview of how Qminder can improve your business and visitors experience.
Try out Qminder for yourself and see how we can improve your business and visitors experience.