

Budget conversations are rarely easy. Asking for a budget increase often feels like pushing uphill, especially when decision-makers want clear proof before approving an increase in budget.
Gut feelings, anecdotes, or “we’ve always done it this way” arguments don’t cut it anymore. What does work is data. Real numbers help show where money is being lost, where demand is growing, and why an increase budget request is not just reasonable but necessary.
When used properly, data turns budget discussions from emotional debates into practical business decisions.
In this blog, we’ll break down how data can support a budget increase, what types of data matter most, and how to present an increase in budget requests in a way that actually gets approved.
Why Budget Requests Often Get Rejected
A budget increase is often rejected not because the need isn’t real, but because the request isn’t backed by clear, measurable proof. Here are some reasons why:
-
Lack of Evidence Behind Funding Needs
When proposals rely on opinions or rough estimates instead of data, it creates doubt. Without hard numbers showing why an increased budget request is necessary, leaders struggle to justify approving it.
-
Competing Priorities Across Departments
When multiple teams ask for a budget increase at the same time, budget officers are forced to choose winners. Without clear data showing impact, an increase in budget request can easily lose out to projects that appear more measurable or urgent.
-
Pressure on Local Governments to Maximize Every Dollar
Today, every increased budget decision is under scrutiny. Leaders must show taxpayers and oversight bodies exactly how funds are used, which makes transparency and proven outcomes critical for securing approval.
The Role of Data in Strengthening Budget Proposals
Data turns a budget increase request from an opinion into a defensible case. When decision-makers can see clear evidence of gaps and impact, an increase in budget feels necessary, not optional.
1. Turning Problems Into Measurable Gaps
Instead of saying something “isn’t working,” data shows exactly where and how it falls short. This makes an increased budget request concrete and easier to approve.
Highlights performance gaps using real metrics, not assumptions
Shows staffing or capacity shortages with clear numbers
Connects service delays or backlogs directly to funding limits
Creates a baseline that justifies why a budget increase is needed now
2. Converting Anecdotes Into Evidence
Stories and complaints matter, but they rarely justify an increase in budget on their own. Data turns those anecdotes into patterns that decision-makers can’t ignore.
Shows rising service demand through volume and usage trends
Tracks backlog growth over time instead of one-off spikes
Quantifies cost overruns tied to delays or outdated processes
Reframes recurring issues as measurable risks that require a budget increase
3. Presenting Data in Decision-Maker Language
Even strong data can fall flat if it’s framed the wrong way. The goal is to translate numbers into outcomes leaders care about when approving an increase in budget.
Connects metrics to operational efficiency and staff productivity
Links performance data to compliance, audit readiness, or risk reduction
Shows how an increase in budget prevents higher future costs
Ties service improvements to public satisfaction and trust
Read more - 9 Proven Benefits of Online Queue Management Systems
What Data to Collect Before Requesting a Budget Increase
Before asking for a budget increase, it’s critical to gather data that clearly shows where current resources are falling short and why an increase in budget is justified.
1. Operational Performance Data
Operational performance data shows how work actually flows through your organization and helps justify a budget increase with facts instead of opinions. It clearly highlights where an increase in budget would have the biggest impact.
This data is usually collected from appointment systems, service logs, queue records, and staff activity reports. Reviewing both average days and peak periods is important, since many budget pressures only appear when demand rises.
Key data points to collect include:
Wait times and delays: Where bottlenecks happen and how often service targets are missed.
Service completion rates: How many requests are handled on time versus delayed.
Workload distribution: Teams or service points that are consistently overloaded.
Productivity trends: How output changes as demand increases or staffing stretches thin.
Together, these metrics show decision-makers exactly why an increased budget request is needed and what problems it will solve.
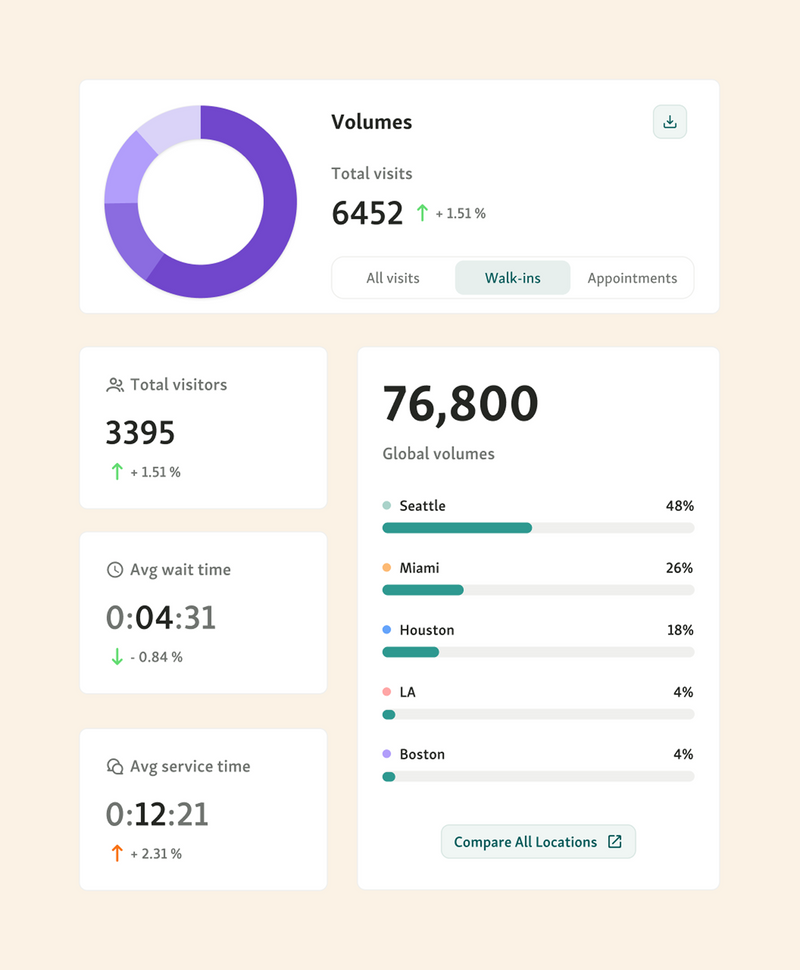
Platforms like Qminder make this easier by tracking real-time service flow, wait times, and staff activity in one place. This allows you to clearly connect a proposed budget increase to measurable improvements in efficiency, capacity, and service delivery.
2. Financial Impact Data
Financial impact data shows how operational issues turn into real costs and why an increase in budget is often the more responsible choice long term. It helps leaders see that avoiding investment can quietly cost more than approving a budget increase.
This data is usually pulled from financial reports, overtime logs, vendor invoices, and service cost breakdowns. When paired with operational data, it paints a clear picture of where money is being lost.
Key areas to track include:
Cost of delays: Overtime pay, backlogs, and extended service hours caused by understaffing or inefficiencies.
Avoidable expenses: Manual rework, error correction, or emergency fixes that could be prevented with better systems.
Operational waste: Underused resources in some areas and overuse in others.
Revenue leakage: Missed billings, abandoned appointments, or unprocessed services.
Efficiency gaps: Spending more to achieve the same output due to outdated workflows.
Presenting these figures makes it easier to justify an increase budget request as a cost-saving move, not just additional spending.
3. Community Impact Indicators
Community impact indicators show how service limitations affect real people, not just internal metrics. They help justify a budget increase by linking funding needs to public outcomes that decision-makers care about.
This data often comes from surveys, complaint logs, accessibility audits, and service usage reports. It highlights where current resources fall short and why an increase in budget can directly improve equity and access.
Key indicators to track include:
Resident satisfaction: Trends in complaints, feedback scores, or repeat issues that signal declining service quality.
Accessibility barriers: Long waits, limited appointment availability, or physical access challenges that disproportionately affect seniors, disabled residents, or low-income communities.
Service bottlenecks: Specific stages where delays stack up and prevent people from completing essential services on time.
Impact on vulnerable groups: Data showing how backlogs or limited hours affect healthcare access, permits, benefits, or public assistance.
When framed clearly, these indicators shift the conversation from “why increase budget?” to “what happens if we don’t approve this increase in budget.”
4. Benchmarking Against Other Agencies
Benchmarking helps strengthen a budget increase request by showing how your agency compares to peers with similar responsibilities. Instead of arguing in isolation, you use external data to explain why your current resources are no longer enough.
This typically involves comparing staffing levels, service capacity, wait times, or cost per transaction with neighboring cities, counties, or agencies of similar size. When benchmarks show consistent gaps, it becomes clear that an increase in budget is not about overspending, but about catching up to reasonable standards.
Useful benchmarking angles include:
Service levels: How your wait times or backlogs compare to regional or national averages.
Staffing ratios: Differences in staff-to-demand ratios that explain burnout or delays.
Cost efficiency: Showing that even with fewer resources, costs are already tightly controlled.
Outcome gaps: Where other agencies achieve better results with appropriate funding.
These comparisons give decision-makers concrete proof that the requested increase in budget is justified, measured, and aligned with how similar agencies operate.
You might also like - How To Use Customer Behavior Data to Improve Service Efficiency in Government Agencies
How to Build a Data-Driven Budget Justification
A successful budget increase request is built on structure, clarity, and evidence. Let’s take a look at
Step 1 - Start With the Problem Statement
Every strong request for a budget increase begins by clearly naming the problem. Spell out what is broken, missing, or no longer sustainable, whether that is growing backlogs, staff overload, service delays, or rising costs. Avoid vague complaints and focus on issues that directly affect service delivery or outcomes.
Pro tip: Write the problem as if no solution exists yet. This keeps the focus on the need before jumping to numbers.
Step 2 - Support Every Claim With Metrics
A budget increase is much easier to approve when every claim is backed by data. Queue management metrics like average wait time, service duration, walk-aways, peak demand, and staff utilization clearly show where an increase in budget is needed and what breaks when funding stays flat.
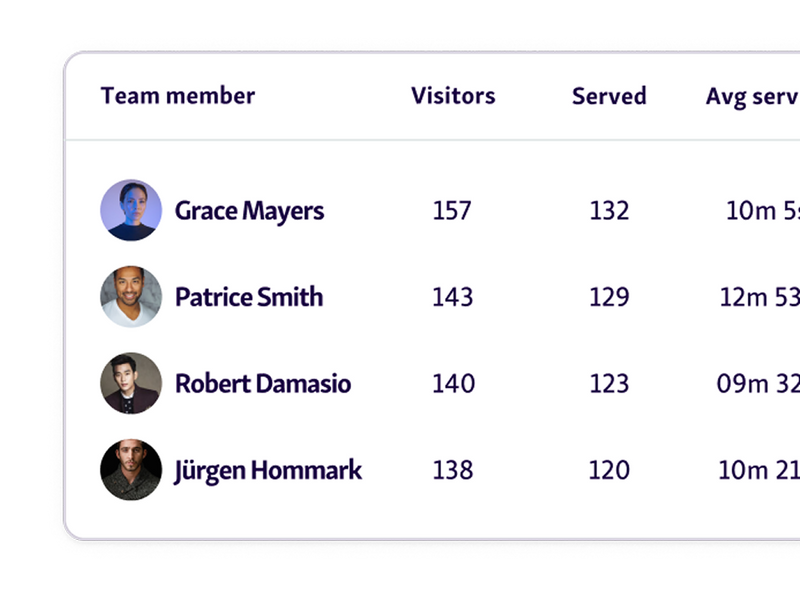
Queue management systems like Qminder can turn daily queue activity into clear queue analytics and trends, making it easy to show year-over-year changes, bottlenecks, and capacity gaps.
Pro tip: Tie each metric directly to a risk or outcome which leaders already care about, delays, compliance gaps, or rising costs.
Step 3 - Show the Consequences of Doing Nothing
When a budget increase is postponed, problems don’t stay flat. Delays grow, risks pile up, and service quality slowly declines. Explaining what happens without an increase in budget helps decision-makers see the real cost of inaction, not just the price tag.
Pro tip: Frame inaction as a future cost, not a neutral choice. Leaders respond faster when they see what gets worse month over month.
Step 4 - Connect the Budget Request to Clear Outcomes
An increased budget request lands better when it’s tied to specific results. Faster service times, lower staff burnout, better compliance, or automation gains show exactly how the increase in budget improves operations and public outcomes.
Pro tip: Use a simple “If funded → then improved” structure. It makes the value of the request immediately obvious.
Presenting the ROI of the Budget Increase
Once the need for an increase in budget is clear, the next step is showing what the organization gets in return. Let’s take a look at how it can be done:
-
Cost Savings and Efficiency Gains
This part explains how an increase budget request leads to measurable improvements, not just higher spending. Investments in better systems, staffing, or automation often reduce repeat work, overtime, errors, and delays.
The purpose here is to show that the budget increase lowers long-term operational costs while improving output. It helps leaders understand that the request isn’t about spending more, but about spending smarter and getting sustainable results.
-
Capacity Expansion and Service Improvements
This part explains what the budget increase actually unlocks. Additional funding allows agencies to serve more people with the same level of quality by expanding staffing capacity, tools, or hours of operation.
The outcome is measurable: faster turnaround times, fewer backlogs, and a smoother experience for citizens. An increase in budget here directly translates into higher service throughput and fewer complaints tied to delays.
-
Long-Term Value vs. Short-Term Spending
This section reframes the increase budget request as a protective investment, not a one-time cost. It shows how spending now prevents recurring losses later, such as overtime overruns, system failures, or compliance penalties.
The benefit of this increase in budget is cost avoidance over time, more predictable operations, and reduced financial risk instead of repeated emergency spending.
Also read - The Long-Term ROI of Implementing Efficient Queue Management in Public Sector Agencies
Using Data Visualizations to Strengthen Your Case
Decision-makers absorb visuals faster than spreadsheets. Clear charts and comparisons help them quickly see why a budget increase is needed and what changes it will unlock. Visuals turn abstract problems into concrete, easy-to-grasp evidence.
-
Before-and-After Scenarios
This is one of the most persuasive ways to justify a budget increase because it shows contrast, not theory.
Start with a simple “before” view. Long wait times, growing backlogs, uneven staff workload, or missed service targets. One chart. One dashboard. No noise. It clearly shows what’s broken today.
Then show the “after.” Same metrics. Same timeframe. But this time, reflect what happens with an increase in budget. Shorter waits. More capacity. Smoother workload distribution. Fewer bottlenecks.
The power here is simplicity. Leaders don’t need to imagine outcomes. They can see exactly what the budget increase buys, where it helps, and why doing nothing keeps the problem stuck in place.
-
Trend Lines and Forecasting Models
Trend lines show how today’s challenges didn’t appear overnight. They map demand, delays, staffing strain, or service volume over time, making it clear whether issues are temporary spikes or long-term trends.
When leaders see steady growth month after month, it reframes the conversation from “do we really need an increase in budget?” to “how long can we afford not to act?”
Forecasting builds on that history. By projecting current trends forward, agencies can show exactly when existing resources will break.
This turns a budget increase into a preventative move, not a reaction. It answers the hardest question decision-makers ask: what happens next if nothing changes?
-
Simple Charts for Clear Decision-Making
Simple charts work because they match how budget decisions actually happen. Executives, boards, and budget committees don’t have time to interpret complex dashboards during a budget review. They need clarity fast.
Qminder’s service intelligence turns queue data into clean, easy-to-read visuals like wait time trends, service volume comparisons, and capacity gaps across locations. Line graphs, bar charts, and side-by-side views make it obvious where performance drops, pressure builds, or demand outpaces resources.
These visuals directly link the increase in budget to measurable outcomes. When the data is clear, conversations stay focused on impact and results, not on questioning the numbers.
Helpful read - How Service Intelligence Helps You Run a Smarter Business
Turn Data Into Decisions That Unlock the Budget You Need
A budget increase is rarely about asking for more money. It’s about proving why current resources no longer match reality. When you use clear data to show service gaps, rising demand, inefficiencies, and future risk, you remove emotion from the conversation and replace it with evidence.
Decision-makers can see exactly what’s broken, what an increase in budget will fix, and what happens if nothing changes. That’s how budget requests stop feeling optional and start feeling necessary.
If you want data that makes budget conversations easier, tools like Qminder help surface the metrics leaders care about most.
See how Qminder can support your next budget increase.
Ideally, data collection should begin several months in advance. This gives you enough time to capture trends, seasonal changes, and recurring issues, rather than relying on short-term snapshots that can be dismissed as anomalies.
Involving both frontline staff and leadership strengthens the request. Frontline teams provide practical insight into daily constraints, while managers help translate those issues into numbers that align with strategic and financial priorities.
Qualitative input still matters, but it’s most effective when paired with data. Use stories or feedback to add context, then support them with metrics so decision-makers can clearly see scale, impact, and urgency.
Get to know our solutions
We will give you a short but great overview of how Qminder can improve your business and visitors experience.
Try out Qminder for yourself and see how we can improve your business and visitors experience.