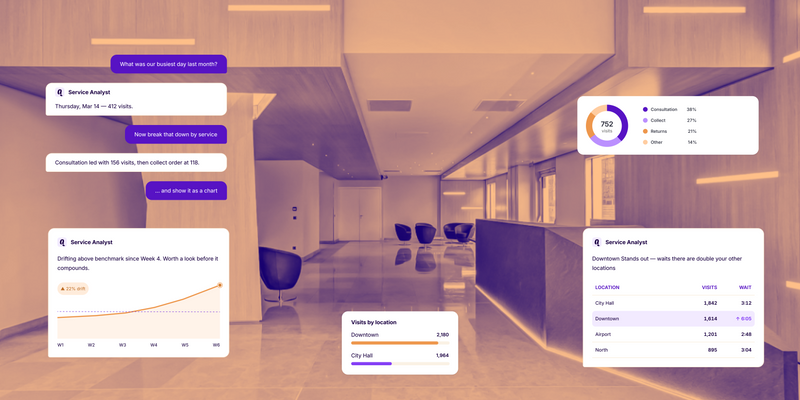
Service Analyst works best when you know what to ask. You don't need to set anything up or learn a query language. Just type a question the way you'd ask a colleague, and Service Analyst responds with an answer, a chart, or a report built from your actual service data.
Here are five questions worth starting with.
1. "How does City Hall compare to Downtown on wait times this month?"
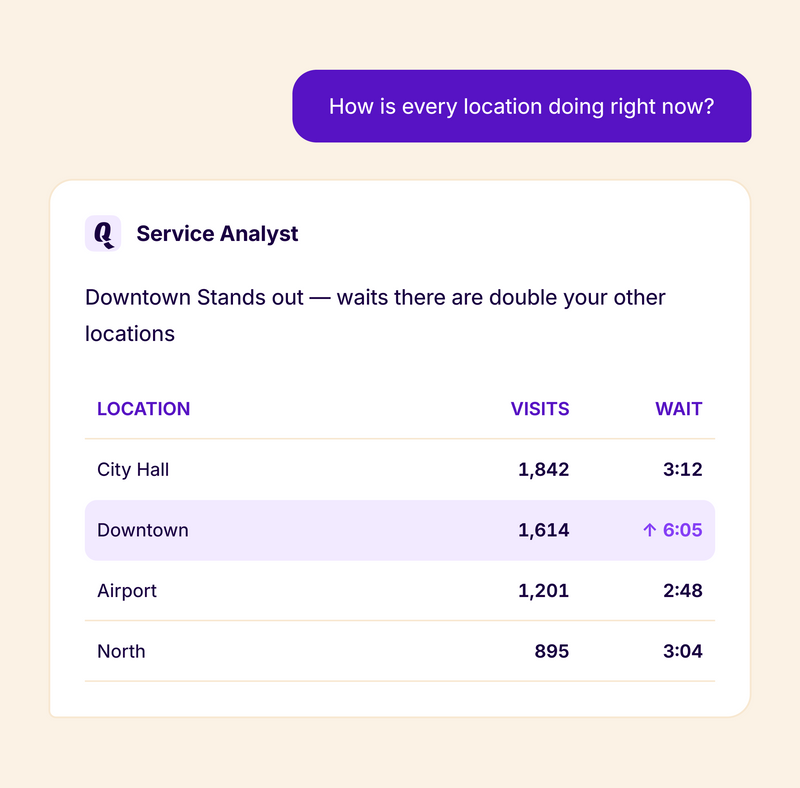
If you run more than one location, this is likely the first thing you want to know. Service Analyst pulls wait time data across your locations and puts it side by side, so you can see where visitors are waiting longest and how locations compare to each other.
You can follow up with specifics: "Break that down by day of the week" or "How does that compare to last month?" Service Analyst keeps the context of your conversation, so each follow-up builds on the previous answer.
2. "What was our busiest day this month, and what made it different?"
Volume spikes don't always have obvious causes. Service Analyst identifies your peak days and looks at what stood out: higher visitor counts, longer service times, a particular service drawing more traffic.
This is the kind of analysis that usually requires pulling data into a spreadsheet. Here, it takes one question.
3. "Which team has the shortest average service time, and how does that compare to the team average?"
Team performance data is valuable when you can see it in context. Service Analyst shows you how individual teams or clerks compare against each other and against the overall average, helping you spot what's working so you can replicate it.
You can go deeper from here: "Show me how that changed over the last 4 weeks" or "Break it down by service type."
4. "Are wait times getting better or worse over the last 4 weeks?"
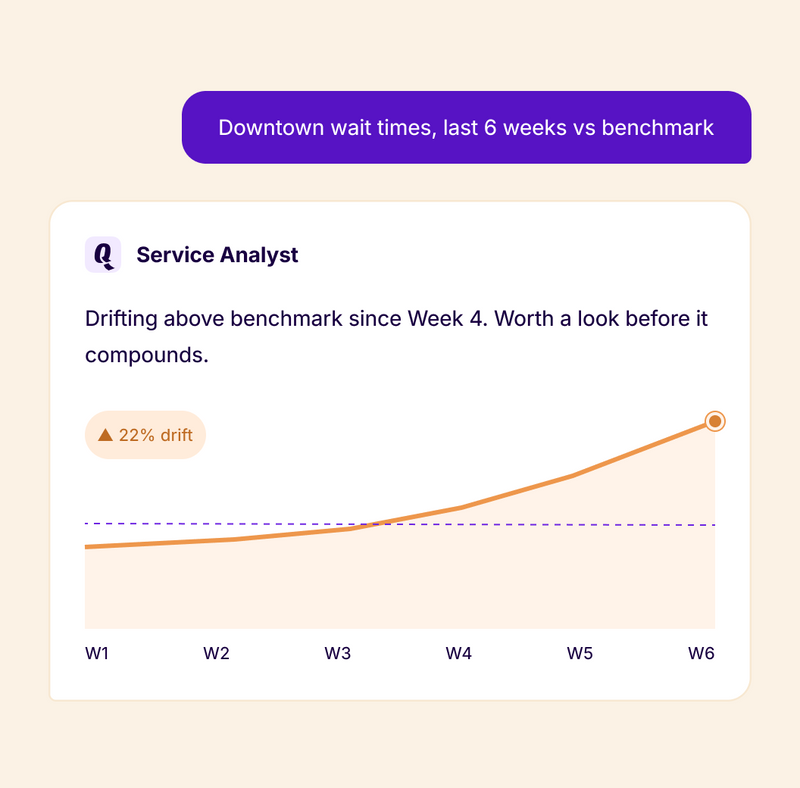
Trend questions are where Service Analyst saves the most time. Instead of comparing weekly snapshots manually, you get a clear picture of direction: are things improving, holding steady, or drifting?
Service Analyst shows the trend visually and calls out what's notable, so you're not left interpreting a chart on your own.
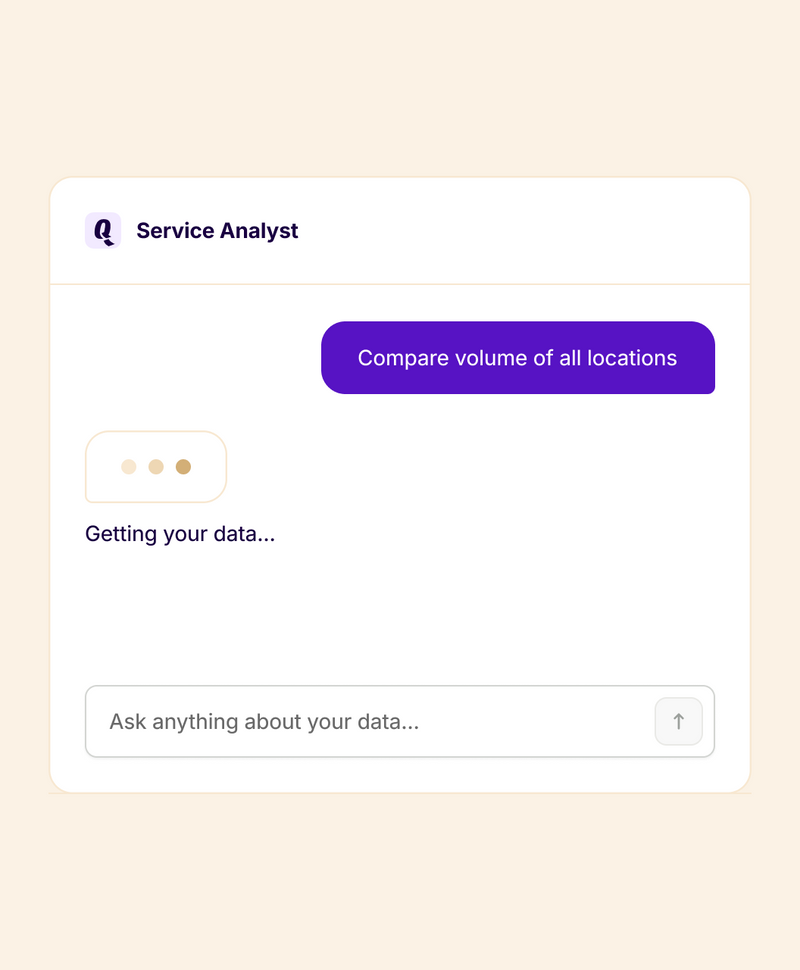
5. "Create a PDF report of last week's performance across all locations."
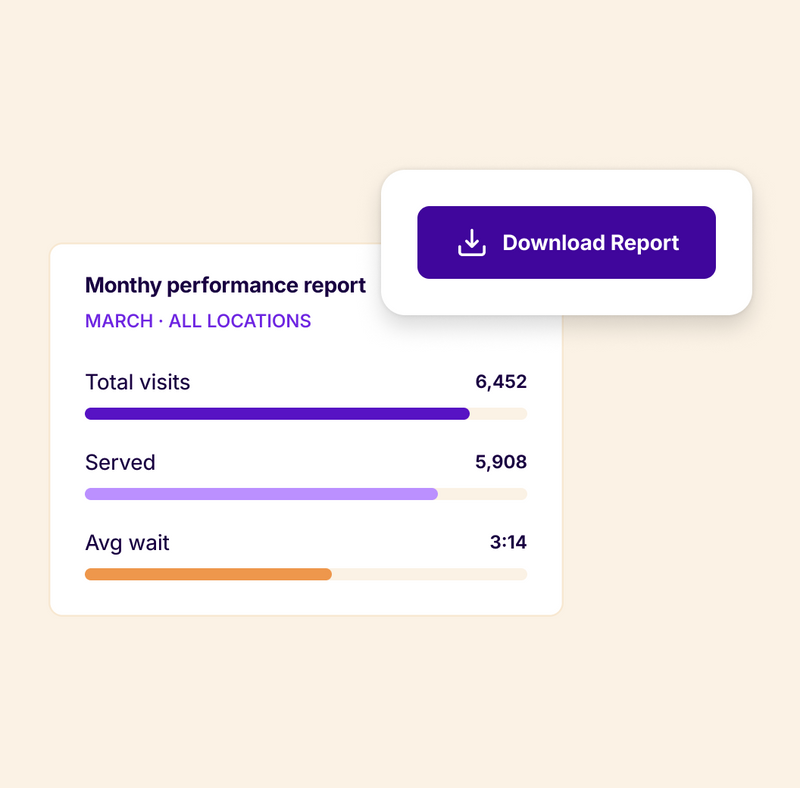
Service Analyst isn't just conversational. You can ask it to generate downloadable reports as PDF or Excel files, complete with charts and tables. Useful when you need to share findings with leadership or bring data into a team meeting.
Just ask for the format you need, and Service Analyst produces a file you can download directly.
What to try next
These five questions are starting points. Once you're comfortable, try:
Comparing specific services: "Which service has the longest wait time at Location A?"
Analyzing sentiment: "What's the sentiment trend for visitor messages this month?"
Asking about labels and input fields: "Break down visits by the Reason for Visit field"
Exporting specific slices: "Give me a spreadsheet of clerk performance for the last 30 days"
For the full list of example queries and tips, visit the Service Analyst Help Center page.
Get to know the author

Aleksandra Sõsun Product Marketing Lead at Qminder
Get to know our solutions
We will give you a short but great overview of how Qminder can improve your business and visitors experience.
Try out Qminder for yourself and see how we can improve your business and visitors experience.