Improving Service Intelligence With Qminder’s Latest Update
We at Qminder have been working tirelessly to bring you the best version of our game-changing solution.
Back in August, we announced a Team Performance upgrade. Since then, we’ve made a number of big improvements that we want to share with you now.
Buckle up, we’ve got a lot of things to cover.
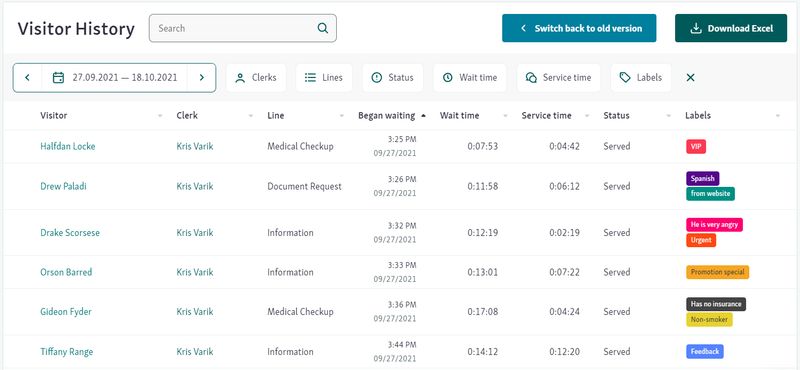
Visitor History: new look, new options
The first major update is for the Visitor History page, which now includes data from labels.
Labels are special notes that you can assign to visitors so that your colleagues have more information about the customer and can better prepare for service.
This valuable data is now stored under its own column and can be accessed when you export the service reports to Excel.
The Visitor History’s new filtering options allow you to choose which labels you want to see. In the example below, we tick the Feedback label to display all customers who have left their feedback.
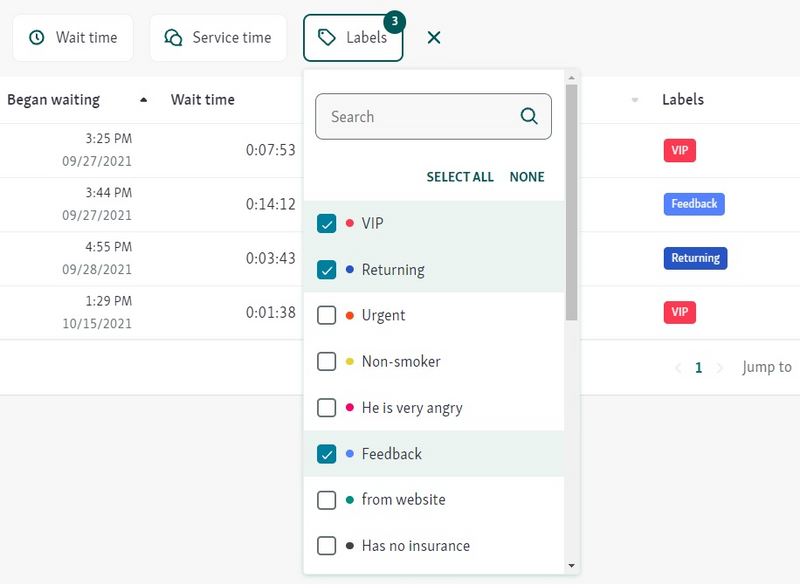
This one change already greatly improves your service intelligence reports, but we’ve got more in stock.
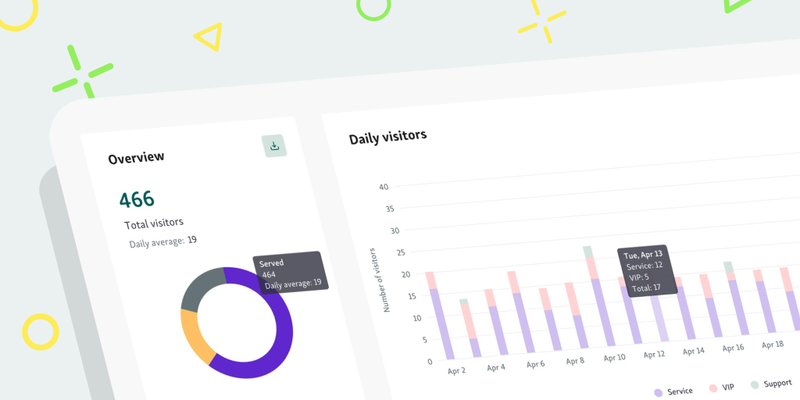
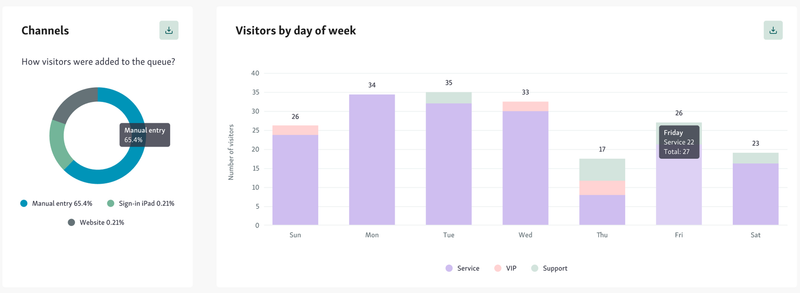
A visual upgrade for Visitor Volumes
Qminder’s Visitor Volumes page has also received some much-needed cosmetic changes.
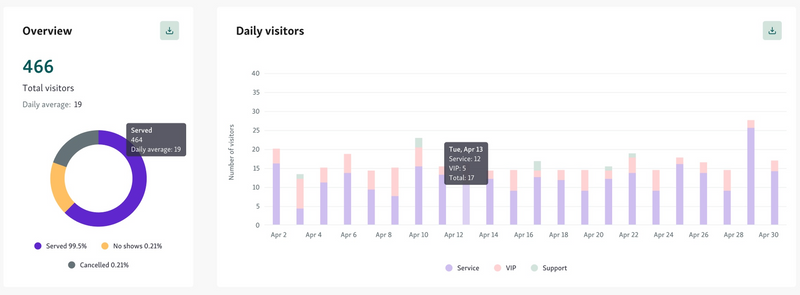
You no longer have to scroll down to see your footfall numbers — the Total visitors metric has been moved to the top-right corner for better visibility and access.
The increased width of charts makes for a more pleasant viewing experience, even on bigger screens. Checking changes over a longer period of time doesn’t require you to scroll, either.
Location Performance gets an overhaul
Last but not least, our Location Performance page has also gotten a visual upgrade. Feast your eyes on the new graphs and filtering options.
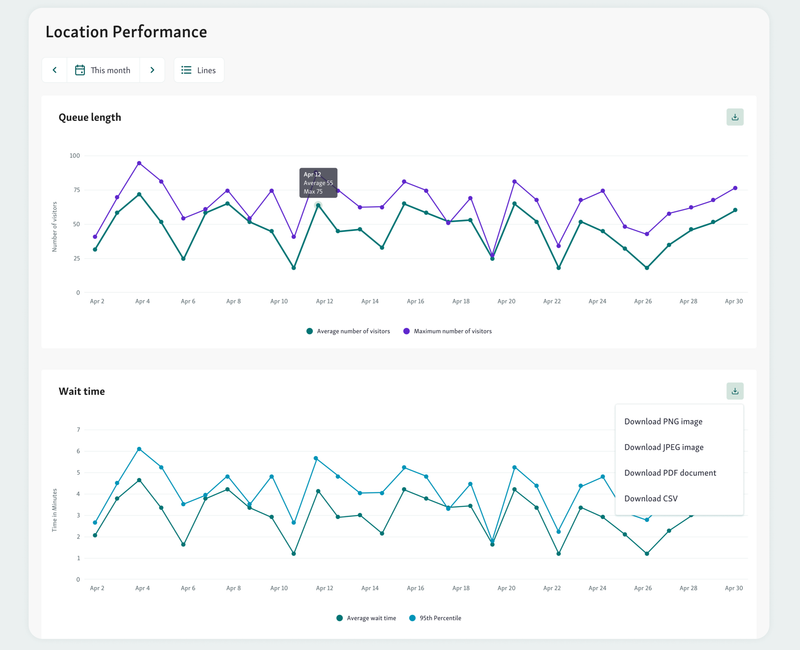
You can easily download graphs — either as JPEG/PNG image, CSV or a PDF document — by clicking on the download icon in the top-right corner.
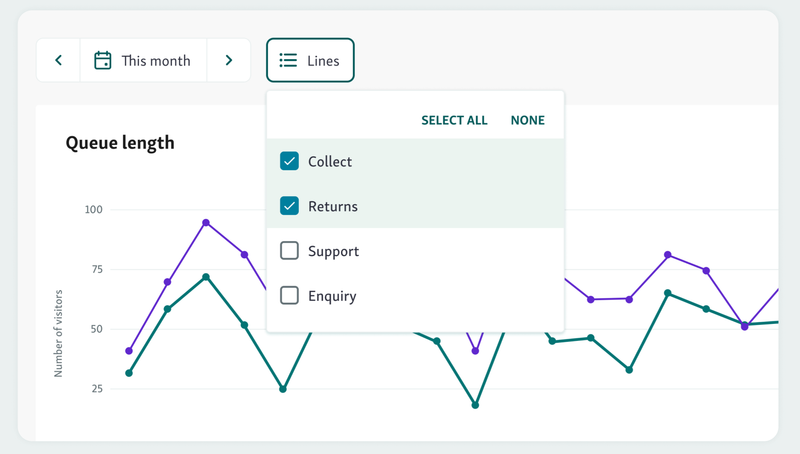
Also, just like with our new Team Performance, you can now select multiple lines when filtering the data. Pick any combination of lines to get as granular as you like and get the exact data points you need to improve your service strategy.

Stay tuned for even more updates coming your way. In the meantime, let us know what you think about the changes we’ve made.